Math 110 Final Exam Topics List – Summer II 2012 **The Final
advertisement
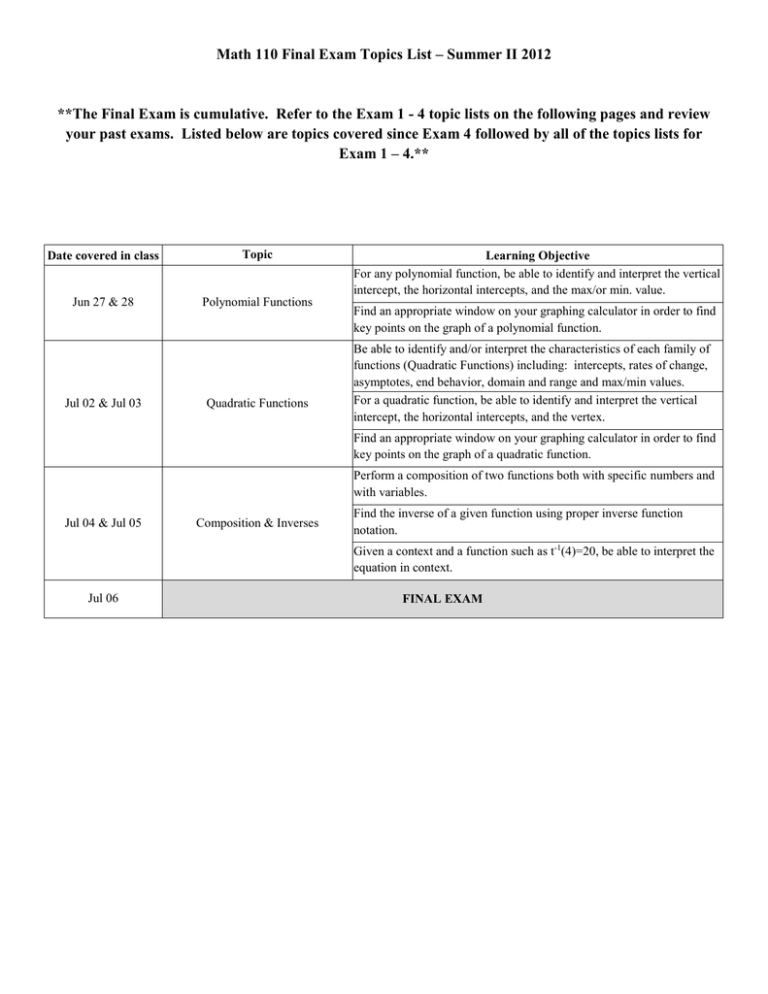
Math 110 Final Exam Topics List – Summer II 2012 **The Final Exam is cumulative. Refer to the Exam 1 - 4 topic lists on the following pages and review your past exams. Listed below are topics covered since Exam 4 followed by all of the topics lists for Exam 1 – 4.** Date covered in class Topic Jun 27 & 28 Polynomial Functions Jul 02 & Jul 03 Quadratic Functions Learning Objective For any polynomial function, be able to identify and interpret the vertical intercept, the horizontal intercepts, and the max/or min. value. Find an appropriate window on your graphing calculator in order to find key points on the graph of a polynomial function. Be able to identify and/or interpret the characteristics of each family of functions (Quadratic Functions) including: intercepts, rates of change, asymptotes, end behavior, domain and range and max/min values. For a quadratic function, be able to identify and interpret the vertical intercept, the horizontal intercepts, and the vertex. Find an appropriate window on your graphing calculator in order to find key points on the graph of a quadratic function. Perform a composition of two functions both with specific numbers and with variables. Jul 04 & Jul 05 Composition & Inverses Find the inverse of a given function using proper inverse function notation. Given a context and a function such as t-1(4)=20, be able to interpret the equation in context. Jul 06 FINAL EXAM Math 110 Exam 4 Topics List – Summer II 2012 Date covered in class Topic Learning Objective Write the general form of a power function and identify the parts of the equation. Identify if a function is directly or indirectly proportional given context, an equation, a table, or a graph. Write the general equation for a power function from context, solve for the constant of proportionality, and give the specific equation Jun 27 & Jun 28 Power Functions Jun 29 Regression Jun 30 Polynomial Functions Sketch the graph of a power function for different powers (even/odd and neg/pos) as well as for functions with either a positive or a negative constant of proportionality. Be able to identify and/or interpret the characteristics of each family of functions (Directly and Indirectly Proportional Power functions) including: intercepts, rates of change, asymptotes, end behavior, and domain and range. Use your calculator to find a curve/ line of best fit. (Remember to reinitialize the independent variable when appropriate) Identify the most appropriate model based both on technology and the context of the situation. Be able to identify and/or interpret the characteristics of each family of functions (Polynomial functions) including: intercepts, rates of change, asymptotes, end behavior, domain and range and max/min values. Given any polynomial function, be able to identify the leading term and the degree and use this information to give the global behavior, the # of turning points, and the # of horizontal intercepts. For any polynomial function, be able to identify and interpret the vertical intercept, the horizontal intercepts, and the max/or min. value. Find an appropriate window on your graphing calculator in order to find key points on the graph of a polynomial function. Jul 01 EXAM 4 Math 110 Exam 3 Topics List – Summer II 2012 Date covered in class Topic Jun 17 and Jun 20 Rules of exponents Learning Objective Simply expressions using the rules of exponents. Be able to write the general form of an exponential equation and identify the parts of the equation. Intro. to Exponential Equations Given a list of equations, be able to identify which equations represent a linear function, which equations represent an exponential function, and which are neither. From a table, be able to determine which functions are linear, which are exponential, and which are neither. Be able to justify your choice. From a table, be able to write a linear and exponential equation. Jun 20 Given a verbal description with a calendar year such as 1995, be able to reinitialize the variable to read: years after 1995. Explain why a linear function better models a relationship. Writing exponential equations from two points Explain why an exponential function better models a relationship. Create an exponential equation from 2 points, one of which is the initial value. Create an exponential equation given the initial value and a rate in Exponential Equations - A constant percentage form. % change Given an exponential equation, be able to determine the rate as a percentage and interpret this value in the context of the situation. Jun 21 Match equations with graphs of exponential functions (growth and decay). Visualizing exponential functions Identify the end behavior for a given function. Identify the asymptotes of a given function. Rewrite a logarithmic equation into exponential form and vice versa. Logarithms Jun 22 Jun 23 Jun 24 Be able to solve for a variable in the exponent using logarithms. Be able to identify and/or interpret the characteristics of each family of Linear, Exponential, and Logarithmic functions (Linear, Exponential, and Logarithmic) including: intercepts, Functions rates of change, asymptotes, end behavior, and domain and range. Identify the parts of the financial formulas: 𝑟 𝑛𝑡 𝑦 = 𝑃0 (1 + ) 𝑂𝑅 𝑦 = 𝑃0 𝑒 𝑟𝑡 𝑛 Financial Formulas Write the appropriate equation using the financial formulas: 𝑟 𝑛𝑡 𝑦 = 𝑃0 (1 + ) 𝑂𝑅 𝑦 = 𝑃0 𝑒 𝑟𝑡 𝑛 Be able to complete all questions on this set of notes. Review EXAM 3 Math 110 Exam 2 Topics List – Summer II 2012 Date covered in class Topic Jun 13 Piecewise Functions Jun 14 & 15 Jun 15 & 16 Linear Systems Linear Programming Learning Objective Write the equation for a piecewise function (from a table, graph, or situation) Given context, define variables, write a linear system, solve a linear system (algebraically (substitution or elimination) and graphically), and interpret the solution. Given context, define variables, write an equation for the objective function, write a system of inequalities (constraints), graph the system of inequalities and shade the feasible region, find all corner points (using substitution or elimination when needed), determine the combination needed to maximize or minimize the objective function, and write a conclusion statement for the problem. Explain what the feasible region represents. Explain what the corner points represent. Jun 17 EXAM 2 Math 110 Exam 1 Topics List – Summer II 2012 Date covered in class Topic Ind/Dep Variables Learning Objective Define independent and dependent variables (labeling with ind/dep, meaning, units, and letter) Identify if a relationship is a function and justify with the definition of a function Demonstrate proper use of function notation Jun 06 Definition of a function, Function Differentiate between the following statements: Evaluate f(0) and Solve f(x)=0. Notation Given input, find output AND interpret the results Given output, find input AND interpret the results Transformations (shifts and reflections) Given an expression or a graph, be able to identify and apply transformations (hor/vert shifts, reflections) Given a table, graph, equation, or situation, be able to identify the domain and range Jun 07 Domain and Range Average Rate of Change Be able to use either interval or inequality notation to define the domain and range Calculate AND interpret the average rate of change Given a table, graph, equation, or situation, be able to identify if the function is a linear function Write the equation of a linear function from a table, graph, or situation Jun 08 Linear Functions Given an initial value and slope, write the equation for a linear function Given a linear function, identify AND interpret the slope and vertical intercept in the context of the problem Given any two points , be able to calculate the slope and the vertical intercept and then write the equation using this information (saucy soda factory question) Differentiate between the vertical and horizontal intercept Linear Functions Find the horizontal intercept and interpret it in the context of the situation Jun 09 Find the domain and range of any linear function View Tubes Lab Jun 10 Apply all concepts above to real data. Analyze data to determine if data can be represented by a linear function. EXAM 1

