On the Primary Care Frontline - National Association of Community
advertisement
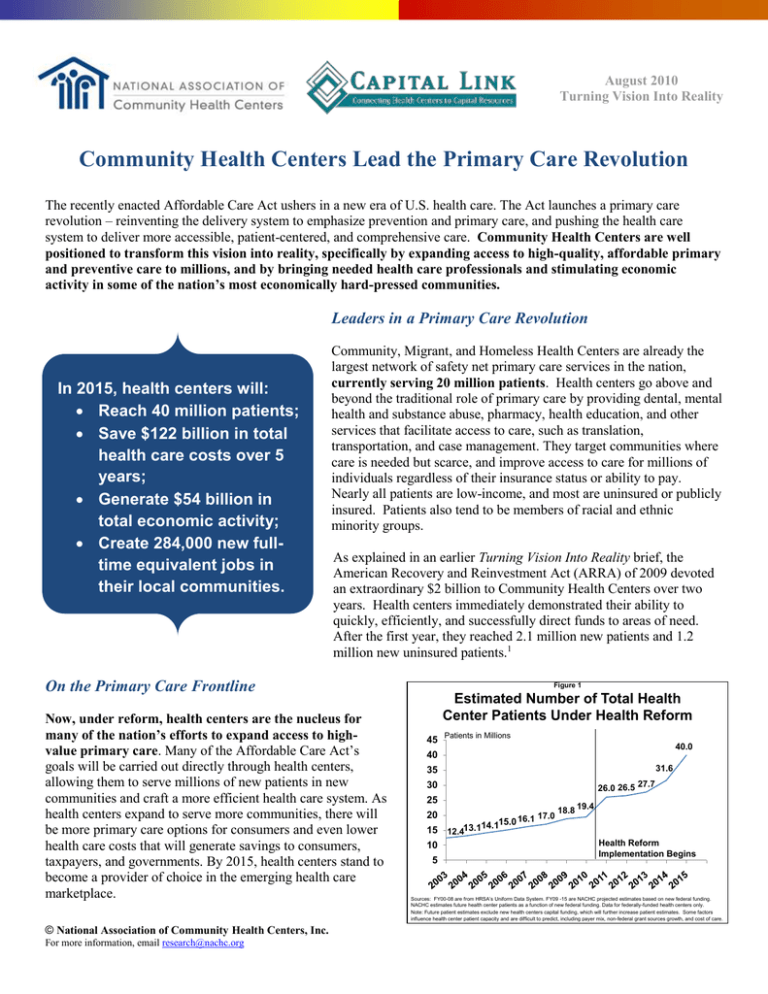
August 2010 Turning Vision Into Reality Community Health Centers Lead the Primary Care Revolution The recently enacted Affordable Care Act ushers in a new era of U.S. health care. The Act launches a primary care revolution – reinventing the delivery system to emphasize prevention and primary care, and pushing the health care system to deliver more accessible, patient-centered, and comprehensive care. Community Health Centers are well positioned to transform this vision into reality, specifically by expanding access to high-quality, affordable primary and preventive care to millions, and by bringing needed health care professionals and stimulating economic activity in some of the nation’s most economically hard-pressed communities. Leaders in a Primary Care Revolution In 2015, health centers will: Reach 40 million patients; Save $122 billion in total health care costs over 5 years; Generate $54 billion in total economic activity; Create 284,000 new fulltime equivalent jobs in their local communities. Community, Migrant, and Homeless Health Centers are already the largest network of safety net primary care services in the nation, currently serving 20 million patients. Health centers go above and beyond the traditional role of primary care by providing dental, mental health and substance abuse, pharmacy, health education, and other services that facilitate access to care, such as translation, transportation, and case management. They target communities where care is needed but scarce, and improve access to care for millions of individuals regardless of their insurance status or ability to pay. Nearly all patients are low-income, and most are uninsured or publicly insured. Patients also tend to be members of racial and ethnic minority groups. As explained in an earlier Turning Vision Into Reality brief, the American Recovery and Reinvestment Act (ARRA) of 2009 devoted an extraordinary $2 billion to Community Health Centers over two years. Health centers immediately demonstrated their ability to quickly, efficiently, and successfully direct funds to areas of need. After the first year, they reached 2.1 million new patients and 1.2 million new uninsured patients.1 On the Primary Care Frontline Now, under reform, health centers are the nucleus for many of the nation’s efforts to expand access to highvalue primary care. Many of the Affordable Care Act’s goals will be carried out directly through health centers, allowing them to serve millions of new patients in new communities and craft a more efficient health care system. As health centers expand to serve more communities, there will be more primary care options for consumers and even lower health care costs that will generate savings to consumers, taxpayers, and governments. By 2015, health centers stand to become a provider of choice in the emerging health care marketplace. © National Association of Community Health Centers, Inc. For more information, email research@nachc.org Figure 1 Estimated Number of Total Health Center Patients Under Health Reform 45 Patients in Millions 40.0 40 31.6 35 26.0 26.5 27.7 30 25 20 15 10 5 16.1 14.115.0 12.413.1 17.0 18.8 19.4 Health Reform Implementation Begins Sources: FY00-08 are from HRSA’s Uniform Data System. FY09 -15 are NACHC projected estimates based on new federal funding. NACHC estimates future health center patients as a function of new federal funding. Data for federally-funded health centers only. Note: Future patient estimates exclude new health centers capital funding, which will further increase patient estimates. Some factors influence health center patient capacity and are difficult to predict, including payer mix, non-federal grant sources growth, and cost of care. Figure 2 Health Center Patients By Payer Source, Pre- and Post-Reform 100% 39% 100% 22% 46% 34% Uninsured Medicaid Other Insured Expanding Capacity for Access: With $11 billion in new funding over five years, Community Health Centers will double their current capacity, reaching 40 million predominately low-income, atrisk patients by 2015 (see Figure 1). This means they will reach approximately one-third of those currently considered “medically disenfranchised” because they live in communities with too few primary care physicians.2 By 2015, health centers will serve 2 out of every 3 people living in poverty. 32% Over the next five years, health centers will see a change in their patients’ insurance coverage (see Figure 2). Many uninsured health center patients will 2010 2015 now become Medicaid eligible – increasing from 34 Source: NACHC analysis, 2010. Estimates for 2010 health center patient are based on expected federally-funded health center patient growth. Health center patient 2015 estimates are based on expected federally-funded health center patient growth, percent to 46 percent of the health center patient Congressional Budget Office estimates of health insurance coverage in 2015 and assumptions based on Massachusetts health reform efforts. population. Other patients will have better access to private insurance. Yet despite broad insurance expansions, many will still be left without insurance and consequently with few places to seek care. Just as they are today, health centers will be a key source of care for the uninsured and underinsured, who will come to rely on health centers even more heavily for their primary care needs. Today, health centers treat nearly 1 out of 7 uninsured. By 2015, the rate will swell to 1 out of 3 uninsured individuals (see Figure 3). 27% Promoting Quality and Efficiency: Health centers deliver care that is equal to or better than other providers and report high patient satisfaction ratings. They improve rates of important screening services, offer prenatal services that improve birth outcomes, narrow gaps in health disparities through routine screenings,3 and boost the health outcomes for the chronically ill while reducing costs. For example, health centers have significantly reduced expected lifetime incidence of diabetes complications, reducing the lifetime incidence of chronic diseases.4 Moreover, they rapidly incorporate and share evidence-based practices regarding quality improvement,5 and are also investing in electronic health records to enhance and better coordinate patient care. Figure 3 Proportion of U.S. Uninsured Population Seen at Health Centers, Pre- and Post-Reform Current (2010) Post-Reform (2015) Source: NACHC estimates of health center patients, 2010. Estimates for 2010 are based on expected federally-funded health center patient growth. Post-Reform estimates are based on CBO estimates of uninsured in health reform and health centers experience with Massachusetts insurance coverage expansion. Building the Medical Home Foundation: Health centers function as medical homes – places for regular care and a personal relationship with a clinician who ensures the delivery of preventive care and appropriate management of complex conditions, coordinates care provided inside and outside the medical home, helps patients understand their conditions, and coaches them on healthy behaviors.6 Medical homes reduce the risk of new health care problems and lower the overall cost of care.7 Health centers go above and beyond the typical standards for medical homes. As community health experts, they add specialized services tailored to meet their communities’ unique cultural and health needs, as well as remove persistent barriers to care. Health center uninsured and Medicaid patients are much more likely to have a usual source of care than their national counterparts.8 They also comprehensively address patients’ needs by utilizing multiple health professionals with varied skills, such as physicians, nurse practitioners, physician assistants, nurses, social workers, case managers, behavioral health specialists, dental providers, health educators, community health workers, and others. Research shows that this type of team-based care improves patient outcomes.9 © National Association of Community Health Centers, Inc. For more information, email research@nachc.org Crossroads Between Public Health and Medical Care: Health centers are frontline providers addressing the health of entire communities, not just their patients. Their federal program standards require that they conduct regular and rigorous community-wide needs assessments, and they regularly provide free health promotion, education, and outreach beyond their patient panel. They are also active participants in disaster preparedness planning. Figure 4 Visits for Select Preventive Services at Health Centers Nationally, 2009 In millions 3.8 Well Infant/Child Visits 3.7 Selected Immunizations 2.3 Seasonal Flu Vaccinations 2.0 Pap Tests Community Health Centers deliver high volumes of services critical for public health, as depicted in Figure 4. The Affordable Care Act requires private health plans to cover evidence-based preventive services and eliminate cost sharing for preventive care starting later this year. This will allow the millions of health center patients who currently have insurance coverage to access specialty preventive services that may be offered beyond the walls of a health center. 0.8 HIV Tests 0.3 Childhood Lead Test Screenings Smoking Cessation Counselings* 0.1 0.0 1.0 2.0 3.0 4.0 5.0 Source: Bureau of Primary Health Care, Health Resources and Services Administration, DHHS. 2009 Uniform Data System. Note: Smoking Cessation Counseling includes smoke and tobacco use counseling. Supplying Cost-Effective Relief Figure 5 Per Person Costs for Health Center Users and Non-Users $5,000 $4,000 $4,594 Health Center Users Non-Users $3,500 $3,000 $2,000 $1,484 $1,021 $812 $1,000 $366 $0 Total Ambulatory Care Hospital Inpatient Care Source: Ku et al. Using Primary Care to Bend the Curve: The Effect of National Health Reform on Health Center Expansions. Geiger Gibson/RCHN Community Health Foundation. June 30 2010. Policy Research Brief No. 19 The Affordable Care Act also seeks to reduce unnecessary health care spending. Health centers reduce the rate of preventable hospitalizations, inpatient days, and Emergency Department (ED) use10 – generating significant returns on investment while improving community health and advancing the primary care revolution. For instance, communities served by health centers have fewer avoidable ED visits than communities without them.11 Health centers currently save $1,093 per person through efficient delivery of needed care. As they expand to reach new, unserved communities, health centers will save up to $122 billion in total health care costs between 2010 and 2015. This includes $55 billion for Medicaid over the fiveyear period. Of that, the federal government would save $32 billion, with states benefiting from the rest.12 Mobilizing the Primary Care Workforce The Affordable Care Act builds on the success of Community Health Centers as anchors for primary care in communities unable to attract or sustain sources for high-quality health care. As health centers expand, they will bring needed health care professionals to communities suffering without, often through newly expanded workforce development programs. Recruiting the Future Frontline: The Affordable Care Act revitalizes primary care as a career choice for future clinicians, and supports health centers’ recruitment efforts. The Act creates a Teaching Health Center Program, which will provide funding to train primary care physicians in health centers and encourage their permanent placement in these settings. Research shows that health center-trained physicians are more than twice as likely as their non-health center trained counterparts to work in an underserved area.13 Among health centers that train any health care professionals onsite, 69 percent report having hired a trainee within the previous five years, according to a 2007 NACHC survey.14 Strengthening the Primary Care Foundation: ARRA invested in the National Health Service Corps (NHSC) program, which provides scholarships and loan repayment to primary care clinicians in return for service in areas needing © National Association of Community Health Centers, Inc. For more information, email research@nachc.org additional health professionals. The Act adds another $1.5 billion over five years to the NHSC. About half of all NHSC clinicians fulfill their service commitment at Community Health Centers.15 The combined ARRA and Affordable Care Act investments in NHSC will bring 16,000 additional health professional to underserved communities, broadening access to medical homes.16 Fueling Economic Activity Health centers rapidly put funds to use and create jobs in their community. They act as a catalyst for significant economic revitalization and create a “ripple effect” of economic activity in communities. Health centers employ people in their communities by providing critical entry-level jobs, training and career development opportunities. As an indirect effect, health centers purchase goods and services from local businesses which spur additional economic activity in their communities. Their employees further induce economic activity by purchasing household and other goods made possible by their salaries. Last year, health centers’ combined economic impact was $20 billion. Beyond fueling economic activity, they also produced 189,158 jobs in the nation’s most economically challenged neighborhoods, according to an analysis completed by Capital Link. Table 1 showcases health centers’ economic impact by state. This excludes much of the $2 billion in ARRA funding, distributed to health centers as grants over two years (2009 through 2011) and yielding a total $3.2 billion in new economic benefits. By 2015, health centers will generate $53.9 billion in total economic activity and create over 284,323 additional full-time equivalent jobs due to the Affordable Care Act.17 This means that every $1 million in federal funding for health center operations yields $1.73 million in return. Figure 6 Community Health Centers’ Economic Impact by State, 2009 Puerto Rico Less than $119,000 Between $120,000 and $229,000 Between $230,000 and $400,000 More than $400,000 Source: The Economic Impact Analysis was prepared by Capital Link with MIG, Inc. IMPLAN Software Version 3.0, 2008 structural matrices, 2008 state-specific multipliers, and data from 2009 Uniform Data System. Equipped for Health Care Reform Health centers have 45 years of experience providing high-quality, cost-effective primary care to underserved communities. They reduce health care expenditures as well as hospital and ED visits, and stimulate economies in local communities that need it the most. When demand for care recently surged in their communities, driven especially by unemployment and loss of insurance coverage during the recession, health centers were able to quickly, efficiently, and successfully target their services where needed. They are able and ready to lead a primary care revolution across the U.S, serving as medical homes and anchoring the primary care workforce in communities with too few health care assets. Health center expansion will magnify their contributions to improved access and community health, all while generating significant economic returns to local, state, and national health care delivery systems. Yet in order to turn this vision into reality, there must be an ongoing, multi-faceted effort to assure that health centers are equipped with adequate resources. Leading the primary care revolution requires sustainable funding to support the expansion of care to more medically disenfranchised individuals and to maintain quality improvement activities. This includes federal, state, and other resources. Improved access to capital funding through both the public and private sectors will secure space for patient growth. Finally, continued support for an adequate, multidisciplinary health professional workforce will ensure health centers have the capacity to serve their patients. For primary care to undergo a revolution as prescribed in the Affordable Care Act, a foundation of evidence-based quality care must be established in the delivery system. Community Health Centers are laboratories of innovations, with proven and locally-crafted best practices, experience providing team-based care and functioning as medical homes, and linkages between public health and medical care. They are blazing the path towards a more accessible, patient-centered, and comprehensive health care system. © National Association of Community Health Centers, Inc. For more information, email research@nachc.org Table 1. Total Health Center Economic Impact by State, 2009 State Alabama Alaska Arizona Arkansas California Colorado Connecticut Delaware District of Columbia Florida Georgia Hawaii Idaho Illinois Indiana Iowa Kansas Kentucky Louisiana Maine Maryland Massachusetts Michigan Minnesota Mississippi Missouri Montana Nebraska Nevada New Hampshire New Jersey New Mexico New York North Carolina North Dakota Ohio Oklahoma Oregon Pennsylvania Puerto Rico Rhode Island South Carolina South Dakota Tennessee Texas Utah Vermont Virginia Washington West Virginia Wisconsin Wyoming Total* Number of FederallyFunded Health Center Organizations 16 26 16 12 118 15 13 4 5 44 28 14 11 36 19 13 13 18 24 18 16 36 29 15 21 21 15 6 2 10 20 15 52 27 4 32 17 25 36 19 8 20 6 23 65 11 8 25 25 29 16 6 1,131 © National Association of Community Health Centers, Inc. For more information, email research@nachc.org Total Patients Total Economic Impact 315,670 86,217 376,081 141,416 2,786,350 449,664 277,506 34,082 107,099 997,110 300,058 126,952 118,818 1,060,723 255,498 154,020 126,098 267,979 202,959 168,287 261,875 564,740 514,987 162,083 310,759 374,855 90,448 57,842 83,148 64,703 413,369 274,397 1,389,385 400,593 28,215 437,672 118,810 256,517 582,382 362,025 118,358 303,115 59,480 361,825 903,586 113,125 107,691 257,111 721,245 373,346 239,027 21,711 18,753,858 $194,609,172 $209,528,820 $436,393,978 $107,631,335 $3,434,654,244 $579,408,724 $385,499,939 $37,343,728 $140,081,354 $877,608,818 $245,580,795 $180,088,619 $97,513,472 $1,082,732,035 $232,248,623 $132,659,924 $87,455,193 $228,231,869 $169,256,482 $172,912,011 $345,217,498 $1,096,120,443 $566,912,895 $214,818,705 $197,819,426 $422,506,377 $73,144,140 $58,310,063 $59,248,521 $77,280,715 $382,432,656 $295,497,470 $1,269,493,264 $331,842,618 $21,923,285 $347,083,172 $112,356,701 $470,409,290 $544,215,885 $243,723,942 $130,325,455 $272,548,491 $46,549,870 $278,364,074 $949,460,539 $106,489,982 $104,009,011 $220,404,799 $934,705,298 $308,218,227 $379,544,478 $21,280,348 $19,935,197,614 Total Employment Produced in Health Centers and Their Communities (FTEs) 2,036 1,651 4,253 1,220 29,642 5,157 3,103 366 1,346 8,855 2,356 1,883 1,086 9,445 2,379 1,434 987 2,238 1,748 1,785 3,070 9,221 5,220 1,853 2,192 4,068 801 651 609 799 3,253 3,144 14,218 3,315 251 3,452 1,122 4,404 4,990 2,883 1,227 2,798 478 2,772 9,394 1,014 1,016 2,237 8,507 3,149 3,392 235 189,183 Sources: Based on 2009 Uniform Data System, Bureau of Primary Health Care, HRSA, DHHS. Nevada health center data provided directly from Nevada health centers. Prepared by Capital Link with MIG, Inc. IMPLAN Software Version 3.0, 2008 structural matrices and 2008 state-specific multipliers. *Total includes other territories which include American Samoa, Fed. States of Micronesia, Guam, Marshall Islands, Palau, and Virgin Islands. Note: The total economic impact and total employment (Full-Time Equivalents) estimates include direct, indirect, and induced effects, as defined below: Direct effects: represents the response for a given industry (Total Expenditures of the organization). Indirect effects: represents the response by all local industries caused by “the iteration of industries purchasing.” Induced effects: represents the response by all local industries to the expenditures of new household income generated by the direct and indirect effects. Total economic impact of $19.9 billion is likely conservative estimate of total economic impact of all health centers nationally since it includes only the federally-funded Community Health Centers and does not include the additional 86 health centers that are not federally funded. These health centers have a considerable economic impact. For more detailed explanation of the methodology, see Appendix B in Access Granted: The Primary Care Payoff. Available at http://www.nachc.com/access-reports.cfm NACHC. “Turning Recession into Reality: More Patients Gain Access to Health Center Care Thanks to Stimulus Funds.” July 2010. http://www.nachc.com/client/ARRA%20Fact%20Sheet%20Final%20revised.pdf 2 NACHC, the Robert Graham Center, and Capital Link. Access Granted: The Primary Care Payoff. August 2007. www.nachc.com/accessreports.cfm. 3 Proser, M. “Deserving the Spotlight: Health Centers Provide High-Quality and Cost-Effective Care.” October-December 2005 Journal of Ambulatory Care Management 28 (4):321-33. 4 Huang E, et al. “The Cost-Effectiveness of Improving Diabetes Care in U.S. Federally Qualified Community Health Centers.” June 2007 Journal of General Internal Medicine, 21(4) supp: 139. 5 Chin M. “Quality Improvement Implementation and Disparities: The Case of the Health Disparities Collaboratives.” August 2010 Medical Care, 48(80):668-75 6 NACHC, Robert Graham Center. Access Denied: A Look At America’s Medically Disenfranchised. March 2007. www.nachc.com/accessreports.cfm. 7 Shi L, et al. “Income Inequality, Primary Care, and Health Indicators.” 1999 Journal of Family Practice 48(4):275-284. Parchman ML and Burge SK. “The Patient-Physician Relationship, Primary Care Attributes, and Preventive Services.” January 2004 Family Medicine 36(1): 22-27. Starfield B and Shi L. “The Medical Home, Access to Care, and Insurance: A Review of Evidence.” May 2004 Pediatrics 113(5): 1493-1498. Williams C. “From Coverage to Care: Exploring Links Between Health Insurance, a Usual Source of Care, and Access.” Policy Brief No. 1. Robert Wood Johnson Foundation, September 2002. 8 Shi, L and Stevens, GD. “The Role of Community Health Centers in Delivering Primary Care to the Underserved.” April-June 2007 Journal of Ambulatory Care Management 30(2):159-170. 9 Institute of Medicine. Crossing the Quality Chasm: A New Health System for the 21st Century. Washington, DC: National Academies Press; 2001. 10 NACHC, the Robert Graham Center, and Capital Link. Access Granted: The Primary Care Payoff. August 2007. www.nachc.com/accessreports.cfm. 11 Rust George, et al. “Presence of a Community Health Center and Uninsured Emergency Department Visit Rates in Rural Counties.” Journal of Rural Health Winter 2009 25(1):8-16. Cunningham P. “What Accounts for Differences in the Use of Hospital Emergency Departments Across U.S. Communities?” July 2006 Health Affairs 25: W324-W336. 12 Ku et al. Using Primary Care to Bend the Curve: The Effect of National Health Reform on Health Center Expansions. Geiger Gibson/RCHN Community Health Foundation Collaborative at the George Washington University. June 30 2010. Policy Research Brief No. 19. http://www.gwumc.edu/sphhs/departments/healthpolicy/dhp_publications/pub_uploads/dhpPublication_61D685D5-5056-9D203DDB6CDE10382393.pdf 13 Morris et al. “Training Family Physicians in Community Health Centers: A Health Workforce Solution.” Fam Med 2008;40(4):271-6 14 NACHC. “Health Profession Training Opportunities at Community Health Centers.” Fact Sheet #0708. July 2008. http://www.nachc.com/client/documents/HPT_Fact_Sheet_FINAL.pdf. 15 National Health Service Corps. Health Resources and Services Administration, DHHS. Loan Repayment Website. http://nhsc.hrsa.gov/loanrepayment/. 16 U.S. Department of Health and Human Services. “Fact Sheet: Creating and Increasing the Number of Primary Care Providers.” http://www.healthcare.gov/news/factsheets/creating_jobs_and_increasing_primary_care_providers.html. 17 Prepared by Capital Link with MIG, Inc. IMPLAN Software Version 3.0, 2008 structural matrices and 2008 state-specific multipliers. Economic Impact estimates are calculated separately for health center operations funding ($9.5 billion in addition to base amount of $2.19 billion) and for capital funds ($1.5 billion) over 5 five years. For estimates based on operation funding, we assumed federal appropriations was 18% of total revenue; median operating margin in 2009 was 2.1%; median economic impact input-output ratio for health center operations was 1.73; annual salary increase per FTE of 3%. For estimate based on capital funding, we assumed the $1.5 billion for capital funding will be dispersed mostly in the first few years; median economic impact input-output ratio for health center capital projects was 1.47; median capital project $ per direct FTE created was $160,738; median input-output ratio for direct to total FTEs for capital projects, is 1.59. For a more detailed explanation, see Appendix B in Access Granted: The Primary Care Payoff. Available at http://www.nachc.com/access-reports.cfm 1 © National Association of Community Health Centers, Inc. For more information, email research@nachc.org
