Week of January 7-11 , 2012 Math 1:00
advertisement

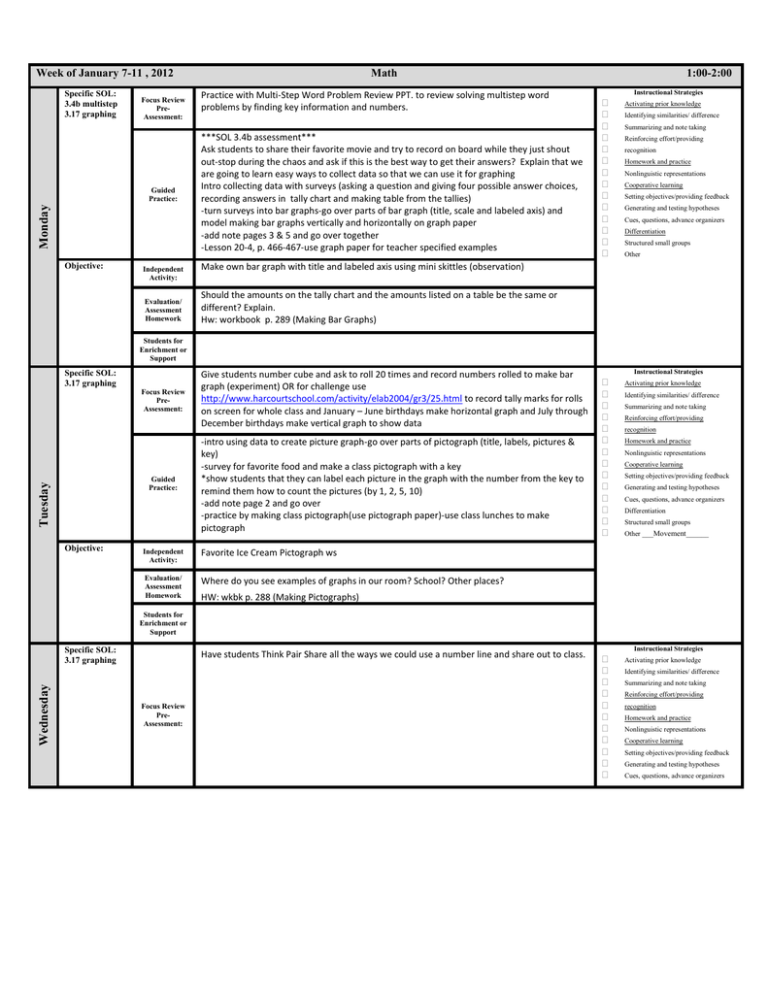
Week of January 7-11 , 2012 Specific SOL: 3.4b multistep 3.17 graphing Focus Review PreAssessment: Monday Guided Practice: Objective: Independent Activity: Evaluation/ Assessment Homework Math Practice with Multi-Step Word Problem Review PPT. to review solving multistep word problems by finding key information and numbers. ***SOL 3.4b assessment*** Ask students to share their favorite movie and try to record on board while they just shout out-stop during the chaos and ask if this is the best way to get their answers? Explain that we are going to learn easy ways to collect data so that we can use it for graphing Intro collecting data with surveys (asking a question and giving four possible answer choices, recording answers in tally chart and making table from the tallies) -turn surveys into bar graphs-go over parts of bar graph (title, scale and labeled axis) and model making bar graphs vertically and horizontally on graph paper -add note pages 3 & 5 and go over together -Lesson 20-4, p. 466-467-use graph paper for teacher specified examples 1:00-2:00 Instructional Strategies Activating prior knowledge Identifying similarities/ difference Summarizing and note taking Reinforcing effort/providing recognition Homework and practice Nonlinguistic representations Cooperative learning Setting objectives/providing feedback Generating and testing hypotheses Cues, questions, advance organizers Differentiation Structured small groups Other Make own bar graph with title and labeled axis using mini skittles (observation) Should the amounts on the tally chart and the amounts listed on a table be the same or different? Explain. Hw: workbook p. 289 (Making Bar Graphs) Students for Enrichment or Support Specific SOL: 3.17 graphing Focus Review PreAssessment: Tuesday Guided Practice: Objective: Give students number cube and ask to roll 20 times and record numbers rolled to make bar graph (experiment) OR for challenge use http://www.harcourtschool.com/activity/elab2004/gr3/25.html to record tally marks for rolls on screen for whole class and January – June birthdays make horizontal graph and July through December birthdays make vertical graph to show data -intro using data to create picture graph-go over parts of pictograph (title, labels, pictures & key) -survey for favorite food and make a class pictograph with a key *show students that they can label each picture in the graph with the number from the key to remind them how to count the pictures (by 1, 2, 5, 10) -add note page 2 and go over -practice by making class pictograph(use pictograph paper)-use class lunches to make pictograph Independent Activity: Favorite Ice Cream Pictograph ws Evaluation/ Assessment Homework Where do you see examples of graphs in our room? School? Other places? Instructional Strategies Activating prior knowledge Identifying similarities/ difference Summarizing and note taking Reinforcing effort/providing recognition Homework and practice Nonlinguistic representations Cooperative learning Setting objectives/providing feedback Generating and testing hypotheses Cues, questions, advance organizers Differentiation Structured small groups Other ___Movement______ HW: wkbk p. 288 (Making Pictographs) Students for Enrichment or Support Wednesday Specific SOL: 3.17 graphing Have students Think Pair Share all the ways we could use a number line and share out to class. Focus Review PreAssessment: Instructional Strategies Activating prior knowledge Identifying similarities/ difference Summarizing and note taking Reinforcing effort/providing recognition Homework and practice Nonlinguistic representations Cooperative learning Setting objectives/providing feedback Generating and testing hypotheses Cues, questions, advance organizers -intro line plots as a way to record data about people on a number line - write a number line with the numbers from 1 to 12 on the board & ask each student to place an x above a number to show the number of letters in their first name. Ask students, “What does the x represent on our line plot?” and “Give two conclusions about the information on our line plot. Guided Practice: Differentiation Structured small groups Other _______________________ -ask students “What kind of data can be displayed on a line plot?”, “How is a line plot different than a bar graph? Pictograph? How are they similar?”, and “When should a line plot be used to show data?” -students draw number line to plot number of brothers and sisters for each student *Use Number Line paper in storage closet-Plenty of copies already made* Objective: Independent Activity: Evaluation/ Assessment Homework Line Plot ws for class work grade Teacher evaluation and line plot ws Students for Enrichment or Support Specific SOL: 3.17 graphing Focus Review PreAssessment: -tell students that 10 students were polled about the number of pencils in their book bag and this is the data collected -have students use the data and knowledge of line plots to find 3 things wrong with the plot (no title, no scale and there is an x above the three -have students correct the line plot Thursday - introduce reading a bar graph to answer questions about the data collected and analyzing to write a statement about the data Guided Practice: Objective: Independent Activity: Evaluation/ Assessment Homework Add note pages 1 & 4 and go over Intro reading bar and pictographs -Explain that many questions will deal with what has the most, least or how many for a specific data point -Discuss being aware of the scale on a bar graph (may not always count by 1’s) and the key on the pictograph -Lesson 20-2 at Pearson Success Net, Practice with various examples from text p. 460-462 -Additional Practice at http://www.ixl.com/math/grade-3/bar-graphs and http://www.ixl.com/math/grade-3/pictographs -Graphing Review PPT from Gwen Best with answers on white boards Instructional Strategies Activating prior knowledge Identifying similarities/ difference Summarizing and note taking Reinforcing effort/providing recognition Homework and practice Nonlinguistic representations Cooperative learning Setting objectives/providing feedback Generating and testing hypotheses Cues, questions, advance organizers Differentiation Structured small groups Other _______________________ Baseball bar graph ws If you wanted to create a graph about the number of milk cartons sold each day at lunch, which graph would you create and why? HW: Fishing Trip Pictographs ws Students for Enrichment or Support Specific SOL: 3.17 graphing Focus Review PreAssessment: -class creates line plot with the number of each month on the number line and the students mark their birth month with an x, students construct line plot on grid paper with a title and label -students create one question for the word wall about the data on the graph Friday Guided Practice: Independent Activity: Objective: Evaluation/ Assessment Homework Students for Enrichment or Support Review making line plots by graphing on a number line the responses for number of letters in first name, number of siblings, number of pets, AR books read in a week, etc. Discuss that sometime we will be given data and have to make the line plot then answer questions about it (see attached example below) Practice on screen at http://www.ixl.com/math/grade-3/line-plots Use Examples from Checkpoints SOL 3.17ab and SOL 3.17c to practice/review as carousel activity 3.17 Graphing Class work grade Instructional Strategies Activating prior knowledge Identifying similarities/ difference Summarizing and note taking Reinforcing effort/providing recognition Homework and practice Nonlinguistic representations Cooperative learning Setting objectives/providing feedback Generating and testing hypotheses Cues, questions, advance organizers Differentiation Structured small groups Other Quiz


