Pictographs Explained
advertisement
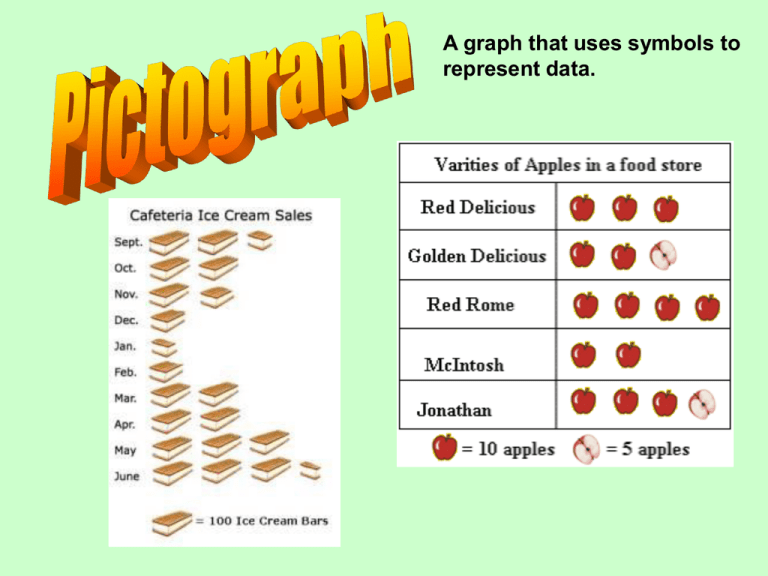
A graph that uses symbols to represent data. Parts of a pictograph graph A pictograph is a graph that uses pictures or symbols to represent data. Each symbol or picture usually represents a multiple piece of data. They may be horizontal or vertical. It is very important to look at the key and determine how many pieces each symbol represents. Activity Example Gather all your data and decide how many pieces you want your symbols to represent. This information must be placed in a key. Place the symbols with the appropriate numbers and labels. Cardinal Dove Crow Blue Jay Birds which have visited our bird feeder =2 birds It is very important to remember the symbol in the key represents multiple pieces. If the data does not match the number of the symbol, the symbol must be cut to represent the fraction of the piece. Cardinal Dove Crow Blue Jay Since each represents 2 birds, the half bird would represent one. There were 3 Cardinals, and 9 Crows. = 2 birds Additional Activities and Resources http://www.superteacherworksheets.com/pictograph.html http://kids-learn.org/chocolate/schulte/schulte.htm http://mysite.verizon.net/res8v21r/Homework/Math/Practice%20Book/Math PBCh01.pdf
