Measurement Practice question
advertisement

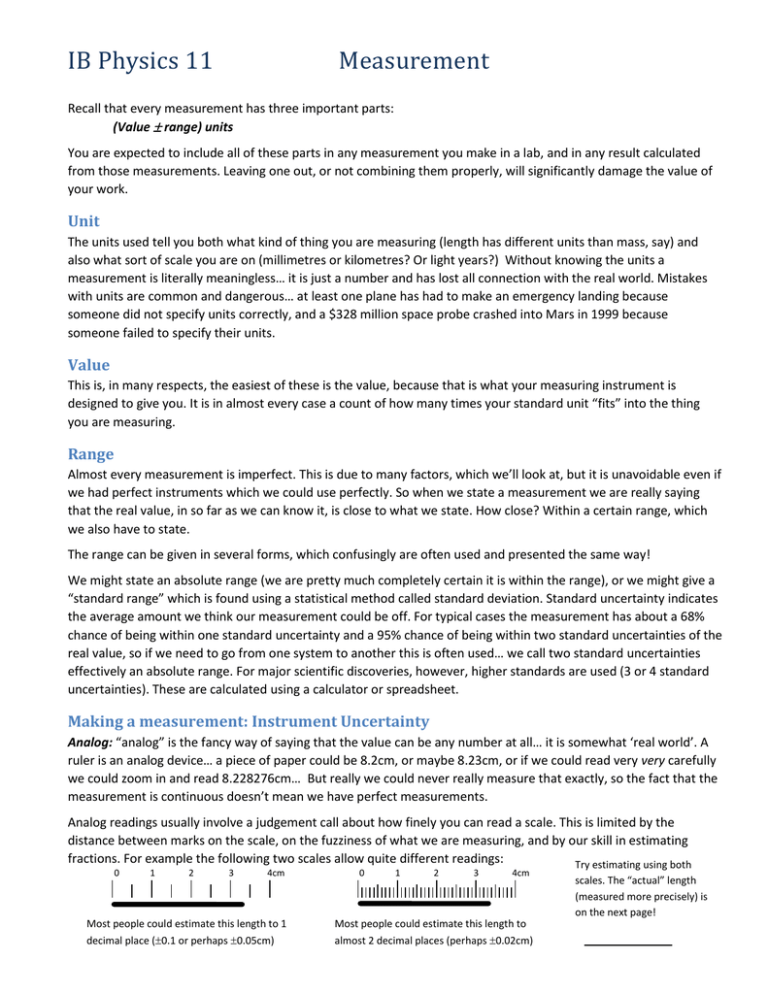
IB Physics 11 Measurement Recall that every measurement has three important parts: (Value range) units You are expected to include all of these parts in any measurement you make in a lab, and in any result calculated from those measurements. Leaving one out, or not combining them properly, will significantly damage the value of your work. Unit The units used tell you both what kind of thing you are measuring (length has different units than mass, say) and also what sort of scale you are on (millimetres or kilometres? Or light years?) Without knowing the units a measurement is literally meaningless… it is just a number and has lost all connection with the real world. Mistakes with units are common and dangerous… at least one plane has had to make an emergency landing because someone did not specify units correctly, and a $328 million space probe crashed into Mars in 1999 because someone failed to specify their units. Value This is, in many respects, the easiest of these is the value, because that is what your measuring instrument is designed to give you. It is in almost every case a count of how many times your standard unit “fits” into the thing you are measuring. Range Almost every measurement is imperfect. This is due to many factors, which we’ll look at, but it is unavoidable even if we had perfect instruments which we could use perfectly. So when we state a measurement we are really saying that the real value, in so far as we can know it, is close to what we state. How close? Within a certain range, which we also have to state. The range can be given in several forms, which confusingly are often used and presented the same way! We might state an absolute range (we are pretty much completely certain it is within the range), or we might give a “standard range” which is found using a statistical method called standard deviation. Standard uncertainty indicates the average amount we think our measurement could be off. For typical cases the measurement has about a 68% chance of being within one standard uncertainty and a 95% chance of being within two standard uncertainties of the real value, so if we need to go from one system to another this is often used… we call two standard uncertainties effectively an absolute range. For major scientific discoveries, however, higher standards are used (3 or 4 standard uncertainties). These are calculated using a calculator or spreadsheet. Making a measurement: Instrument Uncertainty Analog: “analog” is the fancy way of saying that the value can be any number at all… it is somewhat ‘real world’. A ruler is an analog device… a piece of paper could be 8.2cm, or maybe 8.23cm, or if we could read very very carefully we could zoom in and read 8.228276cm… But really we could never really measure that exactly, so the fact that the measurement is continuous doesn’t mean we have perfect measurements. Analog readings usually involve a judgement call about how finely you can read a scale. This is limited by the distance between marks on the scale, on the fuzziness of what we are measuring, and by our skill in estimating fractions. For example the following two scales allow quite different readings: Try estimating using both 0 1 2 3 4cm Most people could estimate this length to 1 decimal place (0.1 or perhaps 0.05cm) 0 1 2 3 4cm Most people could estimate this length to almost 2 decimal places (perhaps 0.02cm) scales. The “actual” length (measured more precisely) is on the next page! A more precise measurement of the line shown is about 3.3800.005 cm. Is that compatible with what you got? To estimate the range for an analog measurement you must ask yourself “What is the largest value that this could read? What is the smallest?” and from those estimates choose a range. Mentally dividing the scale into fractional 1 0 1 0 /3 2/3 1 parts can help with this: The length is between the 0.5 and 1.0 1 /4 1/2 3/4 marks. Splitting that interval into 3 or 4 pieces lets me estimate the best value Looking at the interval and splitting it into fractions I can see that the length is somewhere between 2/3 (0.666…) and 3/4 (0.75). I’d call it 0.700.05. Notice how much better that is than the “half the smallest division” rule that is sometimes quoted – that would give you 0.750.25 which is clearly much too big an uncertainty in this case! However if the divisions were smaller and harder to see (like the mm marks on a ruler) then half the smallest division might be quite good as an estimate. And if the object being measured is hard to measure (fuzzy or blurry say!) then our best range might be more than the smallest division! Try it with these images stolen from the internet: A dial reading (note that this is a negative value!) What is the reading of the upper scale on this ruler? Digital: “digital” readings are inferior to analog ones in that they can only have certain values, so there is a fixed limit to their precision. They have the advantage of being much easier to read, however, and require less judgement, and since we can interface such readings to a computer most easily they are often preferred. There are three major sources of in a digital reading. First there is a built in uncertainty from the design of the instrument. All the decimal places displayed don’t matter if the electronics that produce the reading are not so good! We can’t usually estimate that (unless we can measure some known values) so you have to look at the documentation for the instrument. Where you can’t check documentation or it does not apply (say you are trying to estimate your ability to use a stopwatch, and there is no manual for YOU so you can’t tell how your reaction time will affect things!) then you will have to try measuring a known thing (say timing the second hand on a clock moving through 10 seconds) to see how well you can reproduce the known value. Dial: -5.300.05 (or something similar) Ruler: 1.740.02 (or something similar) The second source of uncertainty is that the reading may fluctuate… a digital voltmeter, say, might sometimes it reads 23.4 and sometimes it reads 23.3 or 23.5 or even 23.6… so you have to guess within what range to give it based on where you think the reading belongs. You might call the previous reading (23.40.2) V. Or perhaps (23.40.1) V if you thought that the more extreme readings were fairly certainly wrong ones. Finally even if the reading never fluctuates at all the last decimal place is almost certainly the result of rounding off a value that would have more decimals after that if the instrument could read them. Therefore a stopwatch stating that the time read is 2.3 s might be anywhere between 2.25 s and 2.35 s, so it would be (2.300.05) s Making a measurement: Uncertainty from a set of measurements In addition to the instrument uncertainty there are other things that will make you less confident about your measured value. The way you use the instrument (such as the angling of a ruler, the way the probes of a voltmeter make contact, etc.) will vary from one measurement to the next, and the thing you are measuring may change too. Random changes due to vibration and other background things will change your exact reading. The only way to get a handle on these sorts of uncertainty is to do repeated measurements, and this is very important to do in any lab! To get a good idea of the best value for a measurement you need at least 3 measurements, and to get a good idea of the range for a measurement more is helpful. Best Value: The best value is usually the mean (average) of the measurements. This is found, as you know, by adding the values and dividing by the number of values you used. There are actually other types of mean which could be used, but these are only important in special cases. height (cm) mean: 177.5 cm standard deviation: 0.5 cm 178.4 178 177.6 177.2 176.8 30 28 26 24 22 20 18 16 14 12 10 8 6 4 2 0 176.4 Number of Measurements 178.4 178 177.6 177.2 176.8 18 16 14 12 10 8 6 4 2 0 176.4 Number of Measurents Data Uncertainty: The uncertainty in a set of data is found using either the spread (maximum – minimum) or the standard deviation. Standard deviation is roughly the average distance between your data points and their average. If the data is very scattered then the standard deviation is large, and if the data is very consistent then the standard deviation is small. height (cm) mean: 177.5 cm standard deviation: 0.3 cm You can use your calculator, graphing calculator (easier to use) or a spreadsheet (easiest!) to find the standard deviation. For example in Microsoft Excel the function stdev.s(range) finds the standard deviation. The standard uncertainty in your average is the standard deviation divided by the square root of the number of measurements. This shows that the more data we measure the more certain we are of our result. A quick and dirty way to estimate standard uncertaintly: Finding the standard deviation and calculating the uncertainty from that is probably best, but there is a quick approximate method that you can use to get effectively the same result. The standard uncertainty in a range of data is usually approximately the spread in the data (maximum – minimum value) divided by the number of measurements. Estimate the data uncertainty in the following sets of measurements using twice the standard uncertainty as your range: 1) 2) 3) 4) 4.46 cm, 4.67 cm, 4.52 cm 25.9g, 25.7g, 22.6g, 25.2g, 21.5g 3.09, 3.16, 3.14, 3.22, 3.13 1.25V, 1.22 V, 1.26 V, 1.24 V, 1.25 V, 1.22 V, 1.25 V, 1.26 V (average: 4.55 cm standard error: 0.11cm (average: 24.18g standard error: 0.88g 4.60.2 cm) 242 g) (average: 3.15 standard error: 0.026 (average: 1.244V standard error: 0.005V 3.150.05) 1.2440.010V or 1.240.01V You will get slightly different results using the standard deviation or ‘quick and dirty’ method, but not very different. Notice that I chose to keep two digits in the uncertainty one case here, you could cut it to one and that would be OK! In a Lab When you do a lab in IB Physics you will need to record your data in a table. At the start of your table state the instrument uncertaintly. Make at least 3 (and ideally more) repeated measurements so you can estimate data uncertainty. The final value you state will have a range equal to the greatest of the two types of uncertainty). Eg: Length (±0.1 cm) 3.0 3.5 … Potential (±0.05V) 1.63,1.74,1.65,1.59 2.26, 2.23, 2.37,2.34 … Length (±0.1 cm) Potential (±0.05V) 3.0 1.63,1.74,1.65,1.59 3.5 2.16, 2.53, 2.37,2.64 … … std err(V) 0.04 0.12 Average(V) 1.65 0.05 2.43 0.12 Calculating with Uncertainty When you use the results of a measurement in a calculation it is natural that your answer will also be a range. Knowing what the range of your answer is requires using one of several methods. The method also depends on whether you are using standard uncertainties or absolute ones. Because calculations using standard uncertainties are actually quite tricky we will avoid that and use absolute uncertainties in our calculations. Remember that the absolute uncertainty, for our purposes, is about twice the standard uncertainty. Later you’ll learn more statistics and can use standard uncertainties. It is also possible to use computing power to “brute force” an answer … one of the clearest methods for this I have seen used the computer to generate a hundred random sets of data using the standard uncertainties of the data, calculated a hundred possible answers, then found the standard uncertainty of those hundred answers! Uncertainty may be stated in relative terms also, usually as a percentage. We will write ?X to mean the uncertainty in X and %X to mean the uncertainty in X expressed as a percentage. So if we measure L=(2.550.05 m) then ?L is 0.05m and %L is 0.05m/2.55m = 2.0% Calculations using absolute uncertainties: Rules There are various rules for combining absolute uncertainties. You will probably use them in other classes, so I mention them here, but we will use a simpler method generally. So don’t worry too much about these rules. Rules for addition and subtraction: ?(X+Y) = ?X + ?Y eg (2.650,04)m – (1.300.03)m = (2.65m – 1.30m) (0.04m+0.03m) = (1.350.07)m ?(X-Y) = ?X + ?Y Rules for multiplication and division: %(XY) = %X + %Y eg (1.350.07)m (2.150.05m) %(X/Y) = = %X + %Y = (1.35m5.2% (2.15m2.3%) = 2.9025m2(5.2%+2.3%)=2.9025m27.5% = (2.90.2)m Rules for powers: %(XN) = N%X eg √4.3 ± 0.2 𝑚2 = (4.3𝑚2 ± 4.7%)1/2 = 2.074m ½(4.7%) = 2.0742.35% = (2.070.05) m Rules for other functions: These get complicated and you need to use your knowledge of calculus. A Better Way! (Largest/Smallest) A much easier way to use absolute uncertainties is to combine the ranges with your basic common-sense knowledge of how numbers work to find the largest and smallest reasonable values of the result. For each measurement in the calculation ask whether the larger or smaller end of the range will give the biggest final answer. The opposite choices will give the smallest possible answer. Use these extreme values to find the largest and smallest answers and from that range find the uncertainty for your answer = (Largest – Smallest)/2 (notice that this is not based on multiple measurements, but is finding how far up or down from the middle our range is). We find the best result using our stated best values, and then match it with the uncertainty Eg: (2.30.1)ms-2 (7.20.2s)2 (3.150.05)s to get the largest answer we want the top of this division to be large and the bottom part to be small. so to find the largest answer we’ll take the largest possible values (2.4 ms-2) and (7.4s) and the smallest value for the bottom (3.1s) and the other way around to find the smallest result 2.4ms-2 (7.4s)2 2.2ms-2 (7.0s)2 = 42.395 m/s Smallest: = 33.688 m/s 3.1s 3.2s range = (42.395 m/s – 33.688 m/s)/2 = (8.707 m/s)/2 = 4.354 m/s = 4 m/s 2.3ms-2 (7.2s)2 Best: = 37.851m/s, match with range (384) m/s 3.15s Largest: That’s a lot of work, but if we did it using the alternative method we would have to do quite a lot too: % uncertainty in 2.30.1 ms-2 = 0.1/2.3 = 4.3% % uncertainty in 7.20.2 s = 0.2/7.2 = 2.8% % uncertainty in 3.150.05 s = 1.6% Total % uncertainty = 4.3% + 2x2.8% + 1.6% = 11.5% 2.3ms-2 (7.2s)2 Value = = 37.851m/s 3.15s Range = 11.5% 37.851 m/s = 4.35 m/s = 4 m/s So matching value and uncertainty gives: (384) m/s Exactly the same thing. Try the following calculations using uncertainties. Use any valid method or a combination of them! 1) vave = 2) v = Answers: (3.250.05)m – (1.840.03)m (12.150.05)s – (4.200.05)s (4.400.02)m (20.40.1)10-9s = What is vave? v 2.99792458108 m/s = = 0.7190.007 2) v=(2.160.02)108 m/s 1) (0.180.01) m/s or (0.1770.012) m/s 1 1 – 2 What is ? =1.4400.015 Additional Practice: 1) Imaginary students doing imaginary experiments gathered the following sets of measurements. For each set find the best value of the measurement, including the uncertainty. a) 3.6 s, 3.1 s, 2.9 s, 3.1 s, 8.2 s b) 4.6kg, 4.5kg, 4.9kg, 5.2kg, 4.7kg, 5.6kg, 5.2kg, 5.1kg, 5.2kg, 5.7kg, 5.0kg, 5.0kg, 4.2kg, 4.8kg 2) Estimate the reading on the following scales: a) 0 1 2 3 4cm b) 0 1 2 3 4cm 3) What is the change in position of the star (use the topmost point to measure position, include ±) 4cm 3 2 1 0 1 2 S 3 4cm N i f 4) Use the Largest/Smallest method to find the value (with error) for the following a) (14.20.1 cm - 11.40.1 cm)2 + (2.350.05cm - 1.100.05cm)2 b) cos(34.50.5)(2.450.05m) sin(11.00.5)


