Lab Report Formats
advertisement
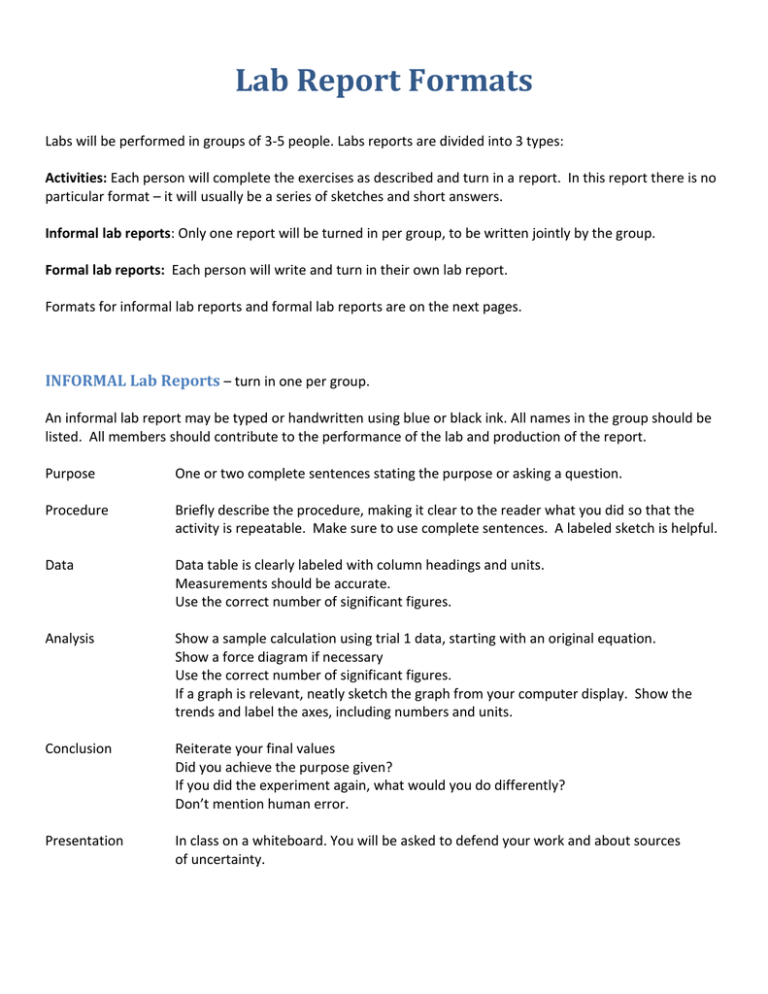
Lab Report Formats Labs will be performed in groups of 3-5 people. Labs reports are divided into 3 types: Activities: Each person will complete the exercises as described and turn in a report. In this report there is no particular format – it will usually be a series of sketches and short answers. Informal lab reports: Only one report will be turned in per group, to be written jointly by the group. Formal lab reports: Each person will write and turn in their own lab report. Formats for informal lab reports and formal lab reports are on the next pages. INFORMAL Lab Reports – turn in one per group. An informal lab report may be typed or handwritten using blue or black ink. All names in the group should be listed. All members should contribute to the performance of the lab and production of the report. Purpose One or two complete sentences stating the purpose or asking a question. Procedure Briefly describe the procedure, making it clear to the reader what you did so that the activity is repeatable. Make sure to use complete sentences. A labeled sketch is helpful. Data Data table is clearly labeled with column headings and units. Measurements should be accurate. Use the correct number of significant figures. Analysis Show a sample calculation using trial 1 data, starting with an original equation. Show a force diagram if necessary Use the correct number of significant figures. If a graph is relevant, neatly sketch the graph from your computer display. Show the trends and label the axes, including numbers and units. Conclusion Reiterate your final values Did you achieve the purpose given? If you did the experiment again, what would you do differently? Don’t mention human error. Presentation In class on a whiteboard. You will be asked to defend your work and about sources of uncertainty. FORMAL Lab Reports – turn in one per person Format Neatly typed or written in blue or black ink. Mistakes neatly crossed out. No scratching out. Graphing is done with a ruler and graph paper, or a program that can be manipulated to give the information needed. Graphs are appropriate size so that data can be examined. Purpose Several complete sentences in which you state the purpose of the lab or ask a question. Procedure A paragraph, usually with a labeled sketch, outlines the main steps of the experiment so that the lab is repeatable. All measured quantities are identified along with how the quantities are measured (distance – a ruler was used to measure the distance between point A and point B). Use complete sentences. Data Data table is clearly labeled with column headings and units. Measurements should be accurate. Include correct units. Use the correct number of significant figures. Analysis Show a sample calculation using date from trial 1, starting with an original equation. Show a force diagram if necessary Use the correct number of significant figures. Make a table if many calculations are made. If a graph is relevant: The points are plotted accurately The curve is appropriate to the data trend. Scales are included with units Axes are labeled with correct variables The graph has a title Slope or curve-fitting information is given on or near the graph If the graph was originally done on the computer it can be copied and pasted into your document. Conclusion Reiterate your final values. Did you achieve the purpose given? Sources of error or uncertainty are thoughtfully discussed. Don’t mention human error.
