Spatial Regression
advertisement

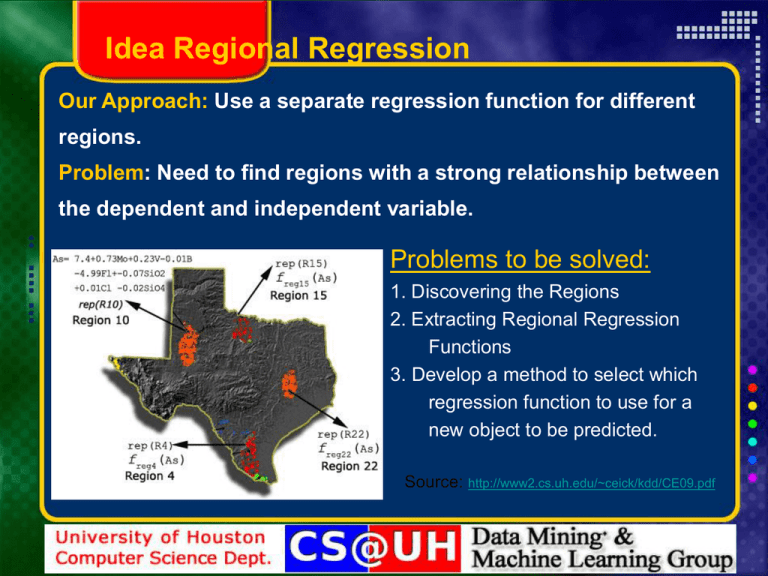
Idea Regional Regression Our Approach: Use a separate regression function for different regions. Problem: Need to find regions with a strong relationship between the dependent and independent variable. Problems to be solved: 1. Discovering the Regions 2. Extracting Regional Regression Functions 3. Develop a method to select which regression function to use for a new object to be predicted. Source: http://www2.cs.uh.edu/~ceick/kdd/CE09.pdf Motivation Regional Knowledge & Coefficient Estimates In geo-referenced dataset, most relationships only exist at regional level but not at the global level. 1st law of geography: “Everything is related to everything else but nearby things are more related than distant things” (Tobler) Coefficient estimates in geo-referenced datasets spatially vary we need regression methods to discover regional coefficient estimates that captures underlying structure of data. Using human-made boundaries (zip code etc.) is not good idea since they do not reflect patterns in spatially variance. Motivation Geo-Regression Analysis Methods Regression Trees Data is split in a top-down approach using a greedy algorithm; uses constants as regression functions Discovers only rectangular shapes Geographically Weighted Regression (GWR) an instance-based, local spatial statistical technique used to analyze spatial non-stationarity. generates a separate regression for each possible query point “online”determined using a grid or kernel a weight assigned to each observation that is based on its distance to the query point. Motivation Arsenic Example 1: Why We Need Regional Knowledge? Fluoride Regression Result: A positive linear regression line (Arsenic increases with increasing Fluoride concentration) Motivation Example 1: Why We Need Regional Knowledge? Arsenic Location 1 Location 2 Fluoride A negative linear Regression line in both locations (Arsenic decreases with increasing Fluoride concentration) A reflection of Simpson’s paradox[16]. Motivation Example 2: Houston House Price Estimate Dependent variable: House_Price Independent variables: noOfRooms, squareFootage, yearBuilt, havePool, attachedGarage, etc.. Motivation Example 2: Houston House Price Estimate Global Regression (OLS) produces the coefficient estimates, R2 value, and error etc.. a model This model assumes all areas have same coefficients E.g. attribute havePool has a coefficient of +9,000 (~having a pool adds $9,000 to a house price) In reality this changes. A house of $100K and a house of $500K or different zip codes or locations. Having a pool in a house in luxury areas is very different (~$40K) than having a pool in a house in Suburbs(~$5K). Motivation Example 2: Houston House Price Estimate Solution: To apply local regression to each zip code produces 50+ sets of parameter estimates it captures spatial variations in the relationship better than global model But it is very naïve and has problems there is spatial variation within zip codes assumes discontinuity but most spatial patterns are continuous and they do not stop & start at the border. Motivation Example 2: Houston House Price Estimate $350,000 $180,000 Houses A, B have very similar characteristics OLS produces single parameter estimates for predictor variables like noOfRooms, squareFootage, yearBuilt, etc Motivation Example 2: Houston House Price Estimate If we use zip code as regions, they are in same region If we use a grid structure They are in different regions but some houses similar to B (lake view) are in same region with A and this will effect coefficient estimate More importantly, the house around U-shape lake show similar pattern and should be in the same region, we miss important information.


