Sharp Math Functions Standard 6th Grade 7th Grade 8th Grade M
advertisement
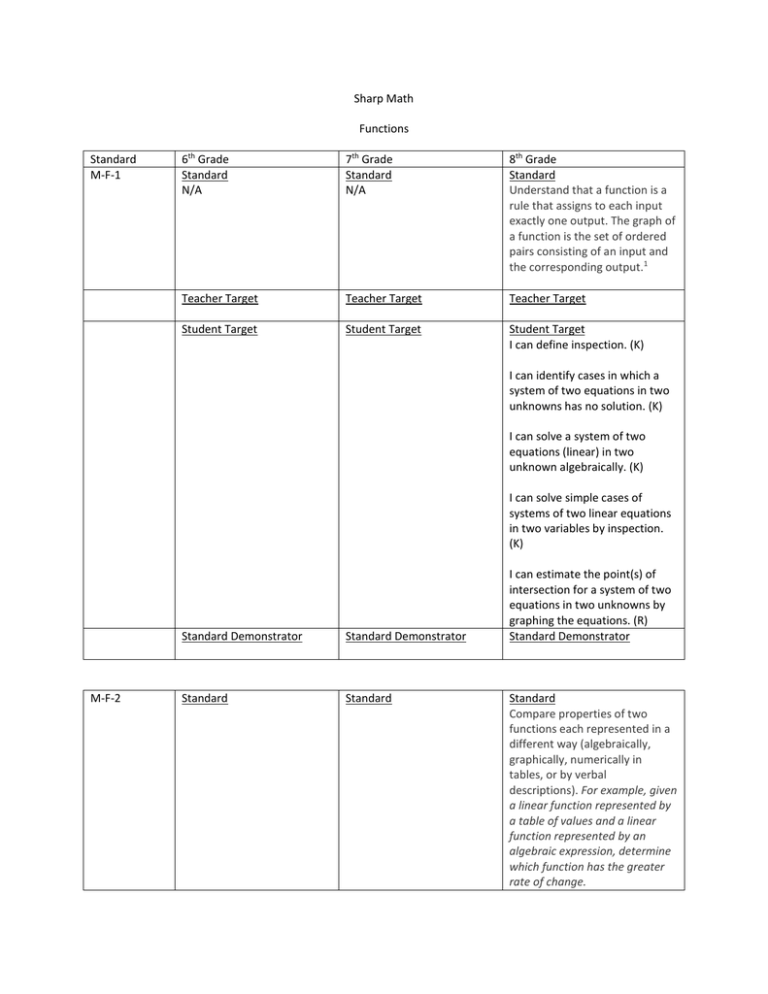
Sharp Math Functions Standard M-F-1 6th Grade Standard N/A 7th Grade Standard N/A 8th Grade Standard Understand that a function is a rule that assigns to each input exactly one output. The graph of a function is the set of ordered pairs consisting of an input and the corresponding output.1 Teacher Target Teacher Target Teacher Target Student Target Student Target Student Target I can define inspection. (K) I can identify cases in which a system of two equations in two unknowns has no solution. (K) I can solve a system of two equations (linear) in two unknown algebraically. (K) I can solve simple cases of systems of two linear equations in two variables by inspection. (K) M-F-2 Standard Demonstrator Standard Demonstrator Standard Standard I can estimate the point(s) of intersection for a system of two equations in two unknowns by graphing the equations. (R) Standard Demonstrator Standard Compare properties of two functions each represented in a different way (algebraically, graphically, numerically in tables, or by verbal descriptions). For example, given a linear function represented by a table of values and a linear function represented by an algebraic expression, determine which function has the greater rate of change. Teacher Target Teacher Target Teacher Target Student Target Student Target Student Target I can identify functions algebraically including slope and y intercept. (K) I can identify functions using graphs. (K) I can identify functions using tables. (K) I can identify functions using verbal descriptions. (K) I can compare and contrast functions with different representations. (R) I can draw conclusions based on different representations of functions. (R) M-F-3 Standard Demonstrator Standard Demonstrator Standard Demonstrator Standard Standard Standard Interpret the equation y = mx + b as defining a linear function, whose graph is a straight line; give examples of functions that are not linear. For example, the function A = s2 giving the area of a square as a function of its side length is not linear because its graph contains the points (1,1), (2,4) and (3,9), which are not on a straight line. Teacher Target Teacher Target Teacher Target Student Target Student Target Student Target I can determine that a linear function is graphed as a straight line. (K) I can explain that the equation y=mx+b is the equation of a function whose graph is a straight line where m is the slope and b is the y-intercept. (K) I can provide examples of nonlinear functions using multiple representations. (K) M-F-4 I can compare the characteristics of linear and nonlinear functions using various representations. (R) Standard Demonstrator Standard Demonstrator Standard Demonstrator Standard Standard Standard Construct a function to model a linear relationship between two quantities. Determine the rate of change and initial value of the function from a description of a relationship or from two (x, y) values, including reading these from a table or from a graph. Interpret the rate of change and initial value of a linear function in terms of the situation it models, and in terms of its graph or a table of values. Teacher Target Teacher Target Teacher Target Student Target Student Target Student Target I can recognize that slope is determined by the constant rate of change. (K) I can recognize that the y intercept is the initial value where x=0. (K) I can determine the rate of change from two (x,y) values, a verbal description, values in a table, or graph. (K) I can construct a function to model a linear relationship between tow quantities. (R) I can relate the rate of change and initial value to real world quantities in a linear function in terms of the situation modeled and in terms of its graph or a table of values. (R) M-F-5 Standard Demonstrator Standard Demonstrator Standard Demonstrator Standard Standard Standard Describe qualitatively the functional relationship between two quantities by analyzing a graph (e.g., where the function is increasing or decreasing, linear or nonlinear). Sketch a graph that exhibits the qualitative features of a function that has been described verbally. Teacher Target Teacher Target Teacher Target Student Target Student Target Student Target I can analyze a graph and describe the functional relationship between two quantities using the qualities of the graph. (K) I can sketch a graph given a verbal description of its qualitative features. (K) I can interpret the relationship between x and y values by analyzing a graph. (R) Standard Demonstrator Standard Demonstrator Standard Demonstrator
