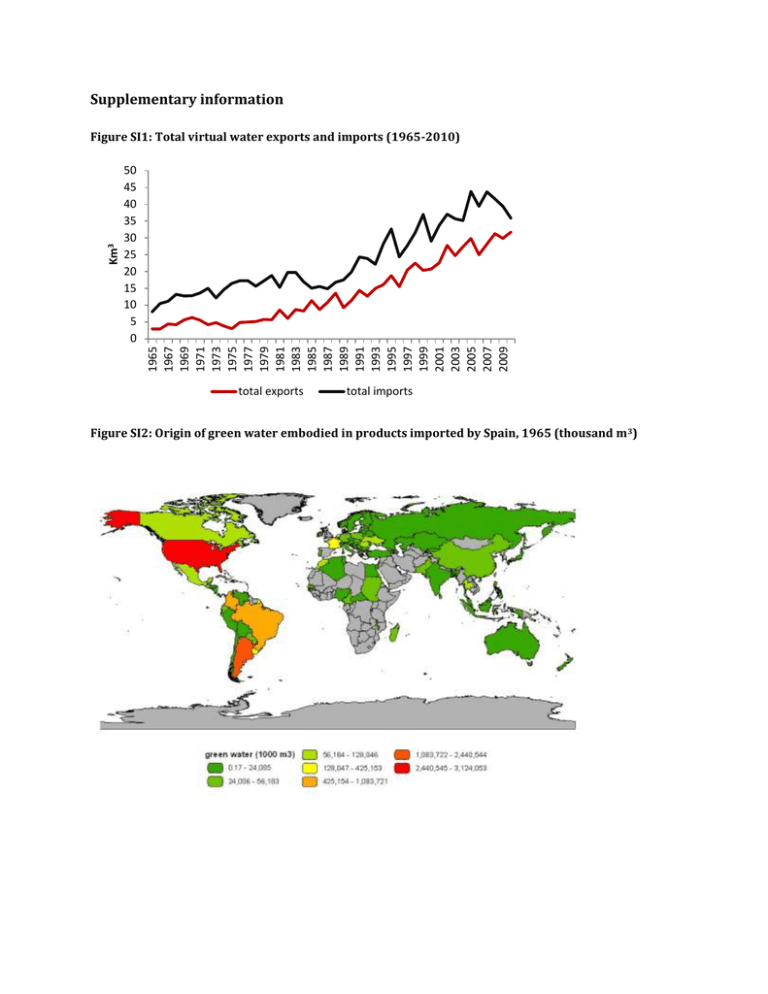
Supplementary information Figure SI1: Total virtual water exports
advertisement

Supplementary information 50 45 40 35 30 25 20 15 10 5 0 1965 1967 1969 1971 1973 1975 1977 1979 1981 1983 1985 1987 1989 1991 1993 1995 1997 1999 2001 2003 2005 2007 2009 Km3 Figure SI1: Total virtual water exports and imports (1965-2010) total exports total imports Figure SI2: Origin of green water embodied in products imported by Spain, 1965 (thousand m 3) Figure SI3: Origin of green water embodied in products imported by Spain, 2010 (thousand m3) Figure SI4: Origin of blue water embodied in products imported by Spain, 1965(thousand m3) Figure SI5: Origin of blue water embodied in products imported by Spain, 2010(thousand m3) Appendix 1: Uncertainty Water coefficients from Mekonnen and Hoekstra (2011, 2012) offer information on the average virtual water content for the years 1996-2005. As we explain in the text, these water intensities (m3/ton) are obtained as the ratio between water demand evapotranspiration (crop water use) and crop yields. Evapotranspiration under non-optimal conditions is dependent on climate, crop characteristics, and management and environmental conditions. While Allen et al., 1998 consider that crop parameters can be assumed to be static, Duarte et al. (2014b) show that real evapotranspiration could be considered stationary in the long term, providing confidence in the hypothesis of constant water evapotranspiration during the period studied. Although it is feasible to assume constant evapotranspiration, the virtual water content of crops and livestock products cannot be considered static, given the significant improvements in technical and managerial water practices taking place from 1965 to 2010. Thus, as described in the text, water intensities (m3/ton) have been modified on the basis of yield series, following Equation 14. Equation 14 assumes a decreasing, convex with respect to the origin, and hyperbolic relationship. The function in equation 14 is a hyperbola that involves the virtual water content gradually declining as crop yield increases (see the blue line in figure SI6). This is an approach in which a dynamic, inverse, and nonlinear relationship between crop yields and virtual water content is assumed (of a crop or group of crops, on average, in a country). However, the function presented in Equation 14 has constant elasticity, which means that a percentage change in the crop yield involves a constant percentage change in the virtual water content. In other words, it is linear in logarithms, but not in levels. There are alternative methods to obtain variable data on the virtual water content of products, such as that proposed by Rockström (2003) and Rockström et al. (2007) for the case of cereals. On the basis of their approach, the water content of water can be related to crop yields WP T following the relationship WP = (1−ebY , where WP is green water productivity (water ) intensity), WPT is green water productivity, b is a constant that determines the rate of decline in evaporation with increased crop canopy, and Y is the crop yield. Figure SI6 (green line) shows that this function is also a decreasing, convex and hyperbolic function. The main difference between these two methods is that, in the case of Rockström (2003) and Rockström et al. (2007), the ratio between the crop yield and the water productivity changes with the level of yield and there exists a horizontal asymptote for a specific level of green water productivity WPT . Figure SI6: Behavior of equation 14 and of the formula proposed by Rockström 4 2.5 x 10 Virual water content 2 1.5 1 0.5 0 0 0.5 1 1.5 2 2.5 Yield 3 3.5 4 4.5 5 Figure obtained for the simulated values: b=-0.2, WPT=500 and wcp*ycp= 2000 The idea of changing rates of decrease constitutes an interesting approach to this relationship but, as can be seen, the full behaviour of this curve depends on two parameters: the optimum level of productive green water (WPT) and the parameter driving the decreasing rate (b). While a formulation in this line could be carried out with precise information about the response rate of detailed crops in specific regions, additional assumptions about b and WPT would be necessary for all crops and countries with which Spain has been trading during more than 40 years. Clearly, this prevents the implementation of such an approach in our analysis. However, both approximations share important characteristics regarding the declining, and the hyperbolic functional form. Additionally, in order to give an evaluation of the bias between both approaches, we have compared the results under the two alternative methods for green water consumption in the case of millet (one of the grains analysed in Rockström (2003)). Thus, we use the values WPT = 800 m3 /ton and b = −0.3 proposed in their paper. The constant green water coefficient given by Mekonnen and Hoekstra (2011) for Millet (1,321.7 m3/ton) is represented by the black series. The relationship between the virtual green water content for millet and its yield, as proposed in our study, is shown in red, and the link between green virtual water content and the yield of millet as proposed by Rockström (2003) is displayed in green. As can be seen in figure SI7, the results seem to be quite similar for most yield levels, showing close R2 coefficients, higher than 0.9. Although discrepancies of around 20% can be found only for the higher yield values, on average, the difference between these two estimates ranges from 5% to 8%. Figure SI7: Comparison of green water intensities for Millet (m3/tom) with constant coefficients from Hoekstra (Black), variable coefficients as in Dalin et al. (2012) (red) and variable coefficients as in Rockström (green).


