Trends in the Periodic Table
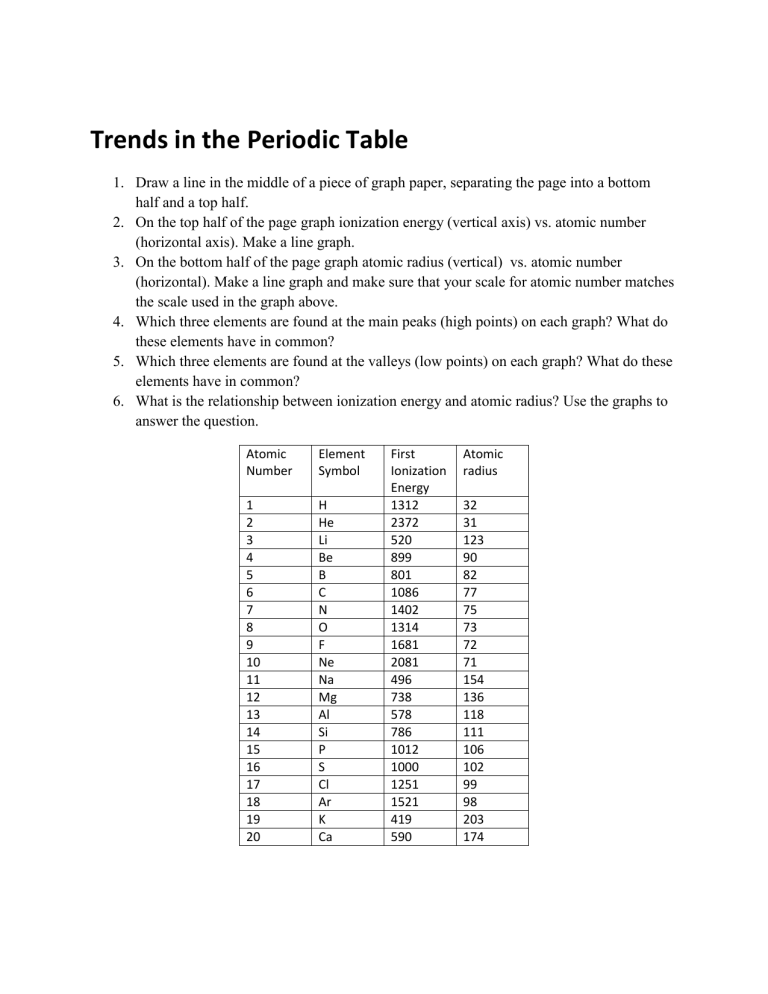
Trends in the Periodic Table
1.
Draw a line in the middle of a piece of graph paper, separating the page into a bottom half and a top half.
2.
On the top half of the page graph ionization energy (vertical axis) vs. atomic number
(horizontal axis). Make a line graph.
3.
On the bottom half of the page graph atomic radius (vertical) vs. atomic number
(horizontal). Make a line graph and make sure that your scale for atomic number matches the scale used in the graph above.
4.
Which three elements are found at the main peaks (high points) on each graph? What do these elements have in common?
5.
Which three elements are found at the valleys (low points) on each graph? What do these elements have in common?
6.
What is the relationship between ionization energy and atomic radius? Use the graphs to answer the question.
Atomic
Number
Element
Symbol
O
F
Ne
Na
Cl
Ar
K
Ca
Mg
Al
Si
P
S
B
C
N
H
He
Li
Be
12
13
14
15
16
8
9
10
11
17
18
19
20
1
2
3
4
5
6
7
738
578
786
1012
1000
1251
1521
419
590
First
Ionization
Energy
1312
2372
520
899
801
1086
1402
1314
1681
2081
496
Atomic radius
73
72
71
154
136
118
111
106
102
99
98
203
174
32
31
123
90
82
77
75
