Atomic Radius Graphing
advertisement
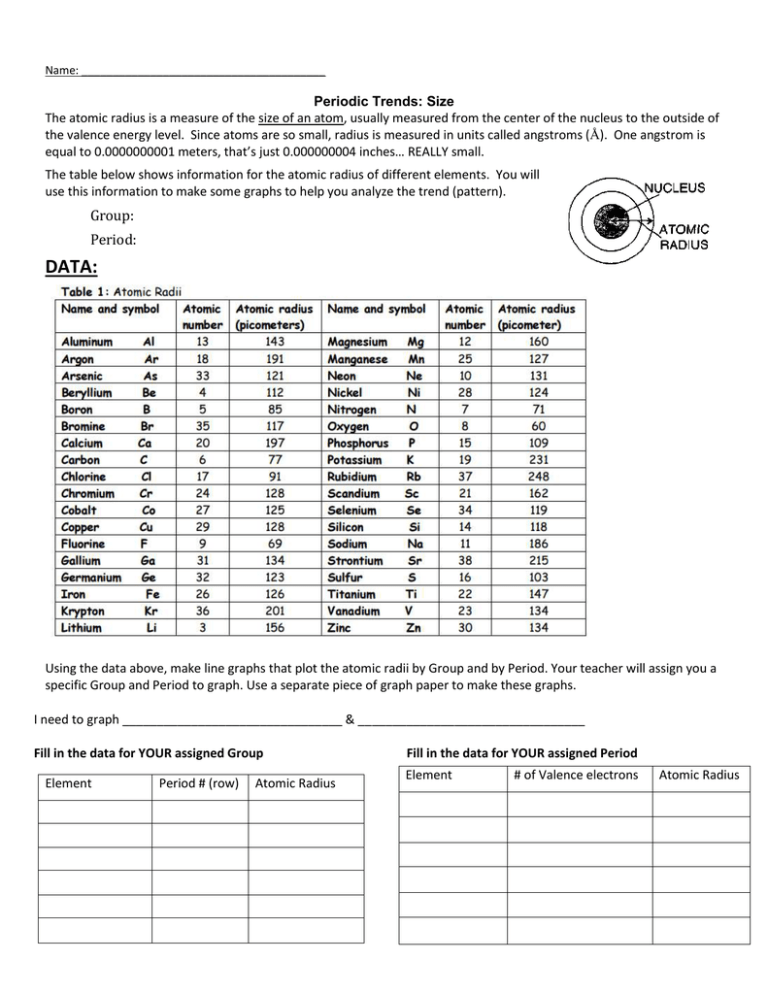
Name: _______________________________________ Periodic Trends: Size The atomic radius is a measure of the size of an atom, usually measured from the center of the nucleus to the outside of the valence energy level. Since atoms are so small, radius is measured in units called angstroms (Å). One angstrom is equal to 0.0000000001 meters, that’s just 0.000000004 inches… REALLY small. The table below shows information for the atomic radius of different elements. You will use this information to make some graphs to help you analyze the trend (pattern). Group: Period: DATA: Using the data above, make line graphs that plot the atomic radii by Group and by Period. Your teacher will assign you a specific Group and Period to graph. Use a separate piece of graph paper to make these graphs. I need to graph ________________________________ & _________________________________ Fill in the data for YOUR assigned Group Element Period # (row) Atomic Radius Fill in the data for YOUR assigned Period Element # of Valence electrons Atomic Radius You will then work with your team to compare how the radius of an atom changes down a Group or across a Period. Don’t forget to: (1) Be neat and use a ruler (2) Label your x-axis and y-axis (3) Make a line graph—dots at each point—NOT a bar graph! (4) Connect your dots using a ruler ATOMIC RADIUS CONCLUSIONS: Use your team’s graphs and the data table to answer these questions. 1. Looking across Period 2 (Li→Be→B→C→N→O→F→Ne), what is happening to the size of the atoms (getting BIGGER or smaller?). 2. Looking across Period 3 (Na→Mg→Al→Si→P→S→Cl→Ar), what is happening to the size of the atoms (getting BIGGER or smaller?). ______________________ 3. Based on this data (answers to #1 and #2), which period 4 atom do you think would be larger, calcium or bromine? Why? ________________________________________________________________________ __________________________________________________________________________________________ 4. Draw a Bohr Model for: Hydrogen Lithium Sodium 5. Look at the data table (not your graph) for group 1. a. What is the radius of H? ____ How many energy levels (rings) does it have?_____ Period? ______ b. What is the radius of Li? ____How many energy levels (rings) does it have? Period? _____ c. What is the radius of Na? ____ How many energy levels (rings) does it have? ____ Period? _____ What is the relationship between energy levels (rings), radius, and the period on the periodic table? 6. Look at the data table (not your graph) for the Noble Gases (group 8). a. What is the radius of He? ____ How many energy levels (rings) does it have?_____ Period? ______ b. What is the radius of Ne? ____How many energy levels (rings) does it have? Period? _____ c. What is the radius of Ar? ____ How many energy levels (rings) does it have? ____ Period? _____ 7. Based on your answers to questions 5 & 6, what is happening to the size of an atom as you go down a group? ________________________________________________________________________________________ ________________________________________________________________________________________ 8. Challenge questions: Explain your answer to question number 7—WHY does this happen? Hint: Look back at #4 and #5 and think about what’s going on as you go down each group. ___________________________________ ___________________________________________________________________________________________ 9. So, which group 2 element do you think would have the largest radius, magnesium or radium? Why? 10. Circle the atom with the largest atomic radius (size) in each group: a. aluminum, sulfur, phosphorus b. arsenic, bismuth, nitrogen c. iodine, strontium, tin d. barium, beryllium, calcium
