Creating Probability Simulations
advertisement
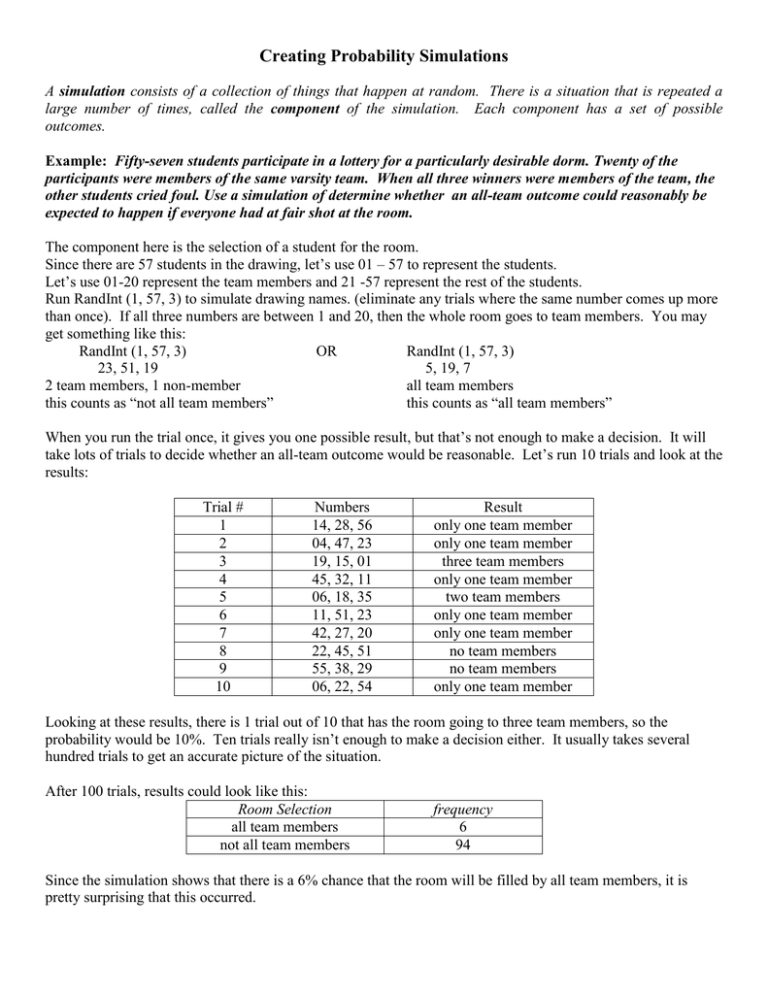
Creating Probability Simulations A simulation consists of a collection of things that happen at random. There is a situation that is repeated a large number of times, called the component of the simulation. Each component has a set of possible outcomes. Example: Fifty-seven students participate in a lottery for a particularly desirable dorm. Twenty of the participants were members of the same varsity team. When all three winners were members of the team, the other students cried foul. Use a simulation of determine whether an all-team outcome could reasonably be expected to happen if everyone had at fair shot at the room. The component here is the selection of a student for the room. Since there are 57 students in the drawing, let’s use 01 – 57 to represent the students. Let’s use 01-20 represent the team members and 21 -57 represent the rest of the students. Run RandInt (1, 57, 3) to simulate drawing names. (eliminate any trials where the same number comes up more than once). If all three numbers are between 1 and 20, then the whole room goes to team members. You may get something like this: RandInt (1, 57, 3) OR RandInt (1, 57, 3) 23, 51, 19 5, 19, 7 2 team members, 1 non-member all team members this counts as “not all team members” this counts as “all team members” When you run the trial once, it gives you one possible result, but that’s not enough to make a decision. It will take lots of trials to decide whether an all-team outcome would be reasonable. Let’s run 10 trials and look at the results: Trial # 1 2 3 4 5 6 7 8 9 10 Numbers 14, 28, 56 04, 47, 23 19, 15, 01 45, 32, 11 06, 18, 35 11, 51, 23 42, 27, 20 22, 45, 51 55, 38, 29 06, 22, 54 Result only one team member only one team member three team members only one team member two team members only one team member only one team member no team members no team members only one team member Looking at these results, there is 1 trial out of 10 that has the room going to three team members, so the probability would be 10%. Ten trials really isn’t enough to make a decision either. It usually takes several hundred trials to get an accurate picture of the situation. After 100 trials, results could look like this: Room Selection all team members not all team members frequency 6 94 Since the simulation shows that there is a 6% chance that the room will be filled by all team members, it is pretty surprising that this occurred. Now you try one: You take a quiz with 6 multiple choice questions. Each question has 4 possible answers. Unfortunately, you forgot there was a quiz today, so you didn’t study at all – you have to guess at the answers. Design a simulation for this situation and determine the probability of getting at least half of the questions right. First, figure out the probabilities we’re working with. P(guessing right) = __________ P(guessing wrong) = ___________ Now we have to assign numbers to use in our simulation that will have the same ratio as these probabilities. Since there are 4 options, use the digits 1 – 4. Let one number represent the correct answer, and the other three will represent the wrong answers. _____ = right answer ______ = wrong answer Now we will run a random integer generator to simulate one try at the quiz. Since there are 6 questions on the quiz, we need 6 numbers. Run RandInt(1, 4, 6) – this will give us 6 numbers between 1 and 4. To run the simulation again, press Enter. Run the simulation 10 times and write your results here: Trial # 1 Numbers Number of Right Answers 2 3 4 5 6 7 8 9 10 What percentage of your trials had at least three answers correct? ___________ To do this simulation properly, it must be run many more times! Now try these. For each problem, set up a simulation, run at least 20 trials, and report your results: 1. You take a quiz with 5 multiple choice questions. After you study, you estimate that you would have about an 80% chance of getting any individual question right. What are your chances of getting them all right? 2. Joe plays on the basketball team and over the course of the season, makes 71% of his free throws. In the championship game, he is fouled late in the game, with his team down by 1 point. What are his chances of making both free throws and winning the game? 3. A cereal company puts prizes in each box. There are 4 different prizes – 20% of the boxes have a blue bouncy ball, 30% of the boxes have a green bouncy ball, 40% of the boxes have a red bouncy ball, and only 10% of the boxes have a multi-colored sparkly bouncy ball. Design a simulation to determine the odds of getting four different bouncy balls if you buy four boxes at a time. KEY: You take a quiz with 6 multiple choice questions. Each question has 4 possible answers. Unfortunately, you forgot there was a quiz today, so you didn’t study at all – you have to guess at the answers. Design a simulation for this situation and determine the probability of getting at least half of the questions right. First, figure out the probabilities we’re working with. P(guessing right) = .25 P(guessing wrong) = .75 Now we have to assign numbers to use in our simulation that will have the same ratio as these probabilities. Since there are 4 options, use the digits 1 – 4. Let one number represent the correct answer, and the other three will represent the wrong answers. 1 = right answer 2, 3, 4 = wrong answer Now we will run a random integer generator to simulate one try at the quiz. Since there are 6 questions on the quiz, we need 6 numbers. Run RandInt(1, 4, 6) – this will give us 6 numbers between 1 and 4. To run the simulation again, press Enter. Run the simulation 10 times and write your results here: Answers will vary based on students’ random numbers. If you want everyone in the class to get the same results, have them seed their calculators. That will put all calculators in the same place on the random number generator. Here’s how you do it: Any number – STO - MATH – PRB – Rand – ENTER. Your number will show up on the calculator screen. Then run the simulation. Trial # 1 Numbers 1, 3, 2, 3, 4, 2 Number of Right Answers 1 2 3, 4, 4, 2, 1, 1, 4 2 3 4, 2, 3, 1, 3, 3 1 4 3, 3, 1, 1, 1, 4 3 5 1, 3, 4, 3, 1, 2 2 6 3, 1, 3, 1, 3, 2 2 7 1, 2, 4, 1, 3, 4 2 8 2, 4, 4, 2, 4, 3 0 9 4, 3, 3, 3, 2, 4 0 10 2, 1, 4, 3, 2, 2 1 What percentage of your trials had at least three answers correct? 1/10 To do this simulation properly, it must be run many more times! These answers are only one way to do these simulations – they can be done many different ways. Now try these. For each problem, set up a simulation, run at least 20 trials, and report your results: 1. You take a quiz with 5 multiple choice questions. After you study, you estimate that you would have about an 80% chance of getting any individual question right. What are your chances of getting them all right? Let 1 – 80 represent a right answer, 81-100 represents a wrong answer. Run RandInt (1, 100, 5) and count how many right answers you receive. Run this 20 times – determine how many of these 20 had 5 correct answers. 2. Joe plays on the basketball team and over the course of the season, makes 71% of his free throws. In the championship game, he is fouled late in the game, with his team down by 1 point. What are his chances of making both free throws and winning the game? Let 1 – 71 represent a made free throw, 72-100 are misses. Run RandInt(1, 100, 2) to represent two free throw shots. Record how many times Joe made both shots out of 20 trials. 3. A cereal company puts prizes in each box. There are 4 different prizes – 20% of the boxes have a blue bouncy ball, 30% of the boxes have a green bouncy ball, 40% of the boxes have a red bouncy ball, and only 10% of the boxes have a multi-colored sparkly bouncy ball. Design a simulation to determine how many boxes you will need to buy to get all 4 bouncy balls. Let 0, 1 = blue; 2, 3, 4 = green; 5, 6, 7, 8 = red, and 9 = multi-colored ball. RandInt (0, 9, 1) will give the color of the first ball. Continue running until all 4 colors are received and record the number of tries it took to get all 4 colors. Repeat and find the mean of the number of tries after 20 trials.
