Cosmo: Lesson 7: H
advertisement

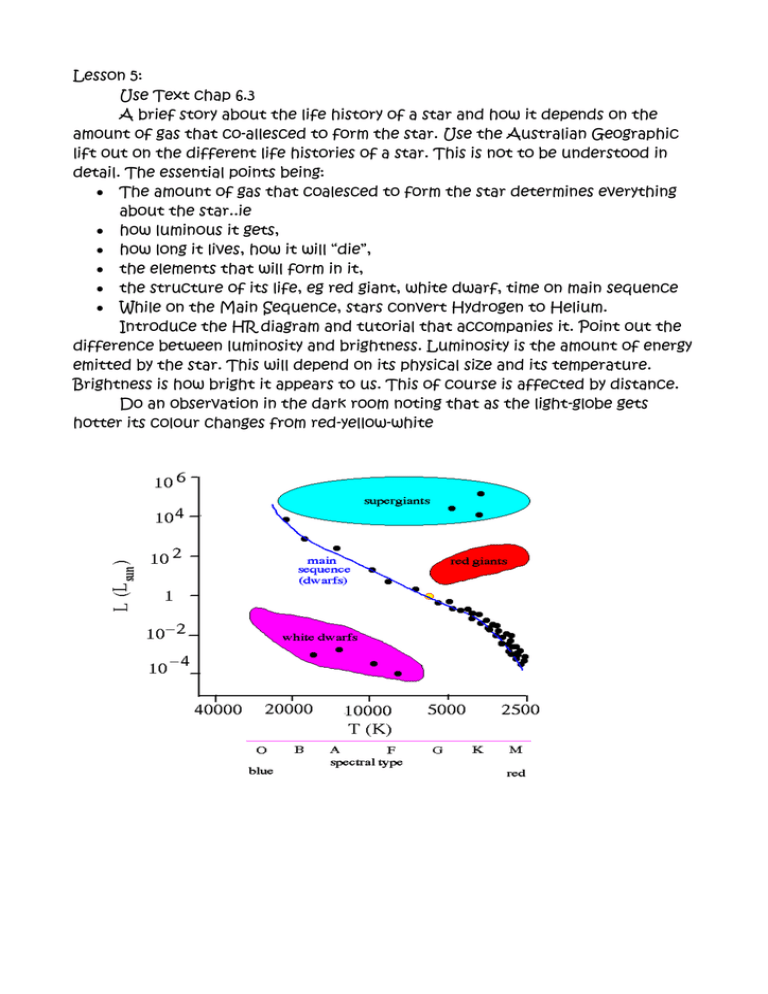
Lesson 5: Use Text chap 6.3 A brief story about the life history of a star and how it depends on the amount of gas that co-allesced to form the star. Use the Australian Geographic lift out on the different life histories of a star. This is not to be understood in detail. The essential points being: The amount of gas that coalesced to form the star determines everything about the star..ie how luminous it gets, how long it lives, how it will “die”, the elements that will form in it, the structure of its life, eg red giant, white dwarf, time on main sequence While on the Main Sequence, stars convert Hydrogen to Helium. Introduce the HR diagram and tutorial that accompanies it. Point out the difference between luminosity and brightness. Luminosity is the amount of energy emitted by the star. This will depend on its physical size and its temperature. Brightness is how bright it appears to us. This of course is affected by distance. Do an observation in the dark room noting that as the light-globe gets hotter its colour changes from red-yellow-white Features: 1/ The y axis is a measure of the Luminosity (intrinsic brightness) of the star. In this diagram the brightness of our sun is taken as 1 and other stars are represented as a multiple of this. 2/ The x axis shows the temperature of the star and also therefore its spectral type. Note the scale is “backwards” with the hottest stars being on the left. Spectral type can loosely (but not exactly) be equated with the colour of the star. Cool stars are red and as the star gets hotter it emits from more of the spectrum. The hottest stars are blue. Our sun is about 60000K which makes it a G class star. By the way OBAFGKM : Oh Be A Fine Girl /Guy Kiss Me. This system was invented by Annie Jump Cannon, another deaf Harvard Computer. (There are no green stars because a star that is hot enough to emit from the green part of the spectrum is also hot enough to emit from the red end so you do get yellow stars.) 3/ The main sequence is the stars that are turning H into He. Other places on the diagrams are stars in other phases of their life cycle. 4/ If you use a spectroscope to examine a star you can tell from its colour where about on the main sequence it is. You therefore know how hot it is and how bright it actually is (Luminosity). If you measure its apparent brightness you can use the inverse square law to work out how distant the star is. 5/ A star will appear on the main sequence as a result of how big it is, ie how much gaseous hydrogen coalesced under the force of gravity to form the star. Lots of gas gives you huge stars. Moderate amounts of gas get you stars like our sun and not much gas gets you failed stars like our planet Jupiter. Huge stars are very bright because they emit from a large surface area and because they are very hot because of the temperatures reached. The monsters have short lives, lasting only millions of years, because they burn so fast. 6/ As stars begin to turn their helium into heavier elements they swell and the outer layers of gas cool to a red colour. These are the red giants. Notice that the Red Giants have left the main sequence. In their cores they are fusing the heavier elements. Surrounding these cores outer layers will be able to continue to fuse hydrogen to Helium. As this happens the star will move off the main sequence. 7/ Stars begin on the main sequence but they do not move from top left to bottom right. Having spent time on the main sequence they will depart and go to another section of the HR diagram. Eg our sun will become a red giant and then become a white dwarf. Details of how other size stars evolve is not required. Except to say that a star 20 times bigger than our sun will end in a Super Nova and leave a black hole behind.


