climographs
advertisement
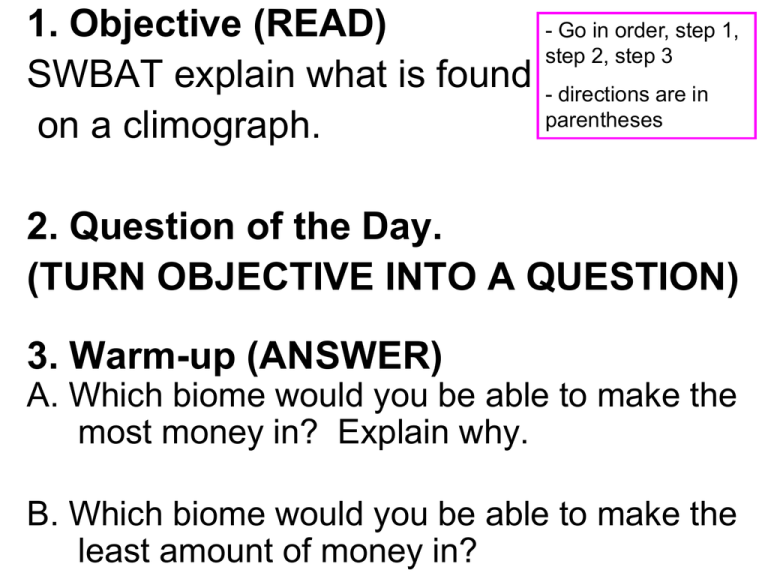
1. Objective (READ) SWBAT explain what is found on a climograph. - Go in order, step 1, step 2, step 3 - directions are in parentheses 2. Question of the Day. (TURN OBJECTIVE INTO A QUESTION) 3. Warm-up (ANSWER) A. Which biome would you be able to make the most money in? Explain why. B. Which biome would you be able to make the least amount of money in? Table of Contents Date Title Lesson # **Thinking Like a Geographer** 9/2 Weathering 5 9/3 Internal Processes 6 9/7 Climate 7 9/9 Climographs 8 1. Make a new page called “Climographs”. 2. Label it page 8. Climographs REVIEW, READ ONLY Major Climate Regions 1. Tropical : Hot and rainy year round (Miami, FL) 2. Arid (Desert): Less than 10 inches of rain per year (Phoenix, AZ) 3. Temperate: Hot and humid summers, mild to cool winters Receives between 20 and 50 inches of rain per year (Washington DC) REVIEW, READ ONLY Major Climate Regions 4. Continental: Dry and hot summers, cool and rainy winters (St. Louis, MO) 5. Polar: Very cold winters with temperatures below zero, low precipitation (Anchorage, AK) How could you arrange climate data and present it to a potential customer without a map? READ ONLY • Climographs - a graphic representation of the climate in a city. • Which of the 5 Themes of Geography would a climograph show? – Place: What is it like there? COPY WHAT IS IN THE BOX COPY WHAT IS IN THE BOX • Climographs include… 1. a line graph measuring average temperature and… 2. a bar graph measuring average rainfall for each month. Hilo, Hawaii – Tropical Temperature Rainfall READ ONLY Las Vegas Climograph - Desert Task complete the questions below in your notebook… 1. How are the climates of Houston and Las Vegas different? 2. How do you know? Houston – Humid Subtropical Task complete the questions below in your notebook… 1. How are the climates of Houston and Las Vegas different? 2. How do you know? Las Vegas - Desert Climograph Help How to read a climograph 1. Use the key Task Complete the questions below in your notebook… 2. Line graph = temperature 1. How would a farmer use a climograph? Bar graph = precipitation 2. How would a tourist use a climograph? 3. 4. Does what you’re thinking make sense? - Can it rain a negative amount? - Are deserts usually cold? 5. Check your axises COPY WHAT IS IN THE BOX 3. What is another profession in which people would find a climograph useful? Explain how they would use it. Climograph Assignment • You have been hired by the US military to analyze the climate of Baghdad. • Major decisions will be made based on your analysis of the climate of the city. – He wants you to determine when is the best month to launch an attack on the city. • Your commander will present you with the following directions… Climograph Assignment Directions: How to Make a Climate Graph: 1. Plot the data on RAIN (precipitation, shown in inches) as a bar graph by month. 2. Plot the data on TEMP (temperature in degrees Fahrenheit [F]) as a line graph by month. 3. Analyze the your climograph to describe the climates in Baghdad. A. What are the seasons like? When is it hot? When is it cooler? B. During which season(s) is it wet? During which season(s) is it dry? C. Predict the which climate zone Baghdad is in. Predict which biome Baghdad is in. D. When would you decide to launch the attack on Baghdad? Jusitfy your decision. Assignment - K 4. Locate a climograph for a city in the United States that could serve as an example of each of the 5 Climate types: Tropical, Arid, Temperate, Continental, Polar. - Identify each climograph with the climate type it matches. - You may print your assignment, email it, bring it on a flash drive, or sketch the climographs on paper. Use the resource below to locate climographs: http://www.drought.unl.edu/whatis/climographsdomesticenglish.htm Assignment - H 4. Locate a climograph for a city in the United States that could serve as an example of each of the 6 Biomes: Rainforest, Grassland, Temperate Forest, Desert, Taiga, Tundra 5. Identify four cities that are extremely susceptible to drought. Your cities must meet the criteria below A) Two must be susceptible to drought year round B) Two must be susceptible to drought only during ONE season. Identify the season in which they are most vulnerable. 6. How could these cities improve their drought vulnerability? - What could they do to increase their water supply? - What could they do to decrease their water usage? Use the resource below to locate climographs: http://www.drought.unl.edu/whatis/climographsdomesticenglish.htm
