Gravity and Orbital Motion - EHS
advertisement
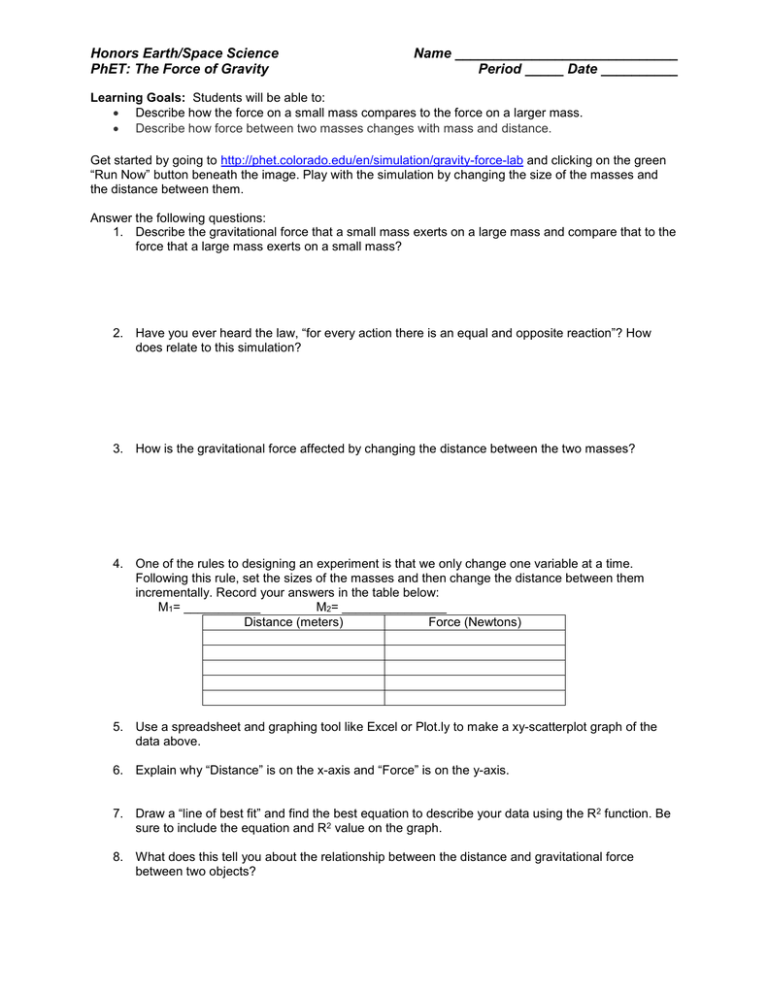
Honors Earth/Space Science PhET: The Force of Gravity Name _____________________________ Period _____ Date __________ Learning Goals: Students will be able to: Describe how the force on a small mass compares to the force on a larger mass. Describe how force between two masses changes with mass and distance. Get started by going to http://phet.colorado.edu/en/simulation/gravity-force-lab and clicking on the green “Run Now” button beneath the image. Play with the simulation by changing the size of the masses and the distance between them. Answer the following questions: 1. Describe the gravitational force that a small mass exerts on a large mass and compare that to the force that a large mass exerts on a small mass? 2. Have you ever heard the law, “for every action there is an equal and opposite reaction”? How does relate to this simulation? 3. How is the gravitational force affected by changing the distance between the two masses? 4. One of the rules to designing an experiment is that we only change one variable at a time. Following this rule, set the sizes of the masses and then change the distance between them incrementally. Record your answers in the table below: M1= ___________ M2= _______________ Distance (meters) Force (Newtons) 5. Use a spreadsheet and graphing tool like Excel or Plot.ly to make a xy-scatterplot graph of the data above. 6. Explain why “Distance” is on the x-axis and “Force” is on the y-axis. 7. Draw a “line of best fit” and find the best equation to describe your data using the R2 function. Be sure to include the equation and R2 value on the graph. 8. What does this tell you about the relationship between the distance and gravitational force between two objects? 9. Now, set the distance and the mass of one of the objects and don’t change them. Incrementally, change the size of the other mass. Record your data in the table below: Distance (m) ____________ Stable Mass (kg) ___________ Changing Mass (meters) Force (Newtons) 10. Use a spreadsheet and graphing tool like Excel or Plot.ly to make a xy-scatterplot graph of the data above. 11. Explain why “Mass” is on the x-axis and “Force” is on the y-axis. 12. Draw a “line of best fit” and find the best equation to describe your data using the R2 function. Be sure to include the equation and R2 value on the graph. 13. What does this tell you about the relationship between the size of the mass and the gravitational force between two objects? 14. Does this relationship hold true for the other mass? Explain. 15. Look up the equation for “Newton’s Law of the Force of Gravity”. Record the law below, record the value of G, and describe how it is consistent with the data that you have gathered in this activity. 16. So, if the mass of the Sun = 1.98892 × 1030 kilograms and the mass of Earth = 5.9742 × 1024 kilograms, what is the force of gravity between the two bodies? PART 2: Introduction to Gravity and Orbital Motion 1. The picture below shows the Earth and the Sun, looking down at Earth’s north pole. Draw how you think Earth moves around the Sun. 2. On the picture above, draw arrows showing what you think the forces might be on the Earth and the Sun. You can draw a longer arrow to represent a big force, and a shorter arrow to represent a small force. (These arrows are officially known as…VECTORS!) 3. Draw a picture of how you think the Earth would move if these forces were not there. 4. Open the Gravity and Orbits simulation at https://phet.colorado.edu/en/simulation/gravity-andorbits . Take a few minutes to explore how the Earth, Moon, and the Space Station move. Talk about what you find with your partner. List the simulation controls below and talk to a couple of other groups to make sure you haven’t missed anything. 5. Compare the motion of the Earth moving around the Sun with the Moon moving around the Earth. Earth moves around the Sun Moon moves around the Earth Your Picture Your Picture Your Description Your Description What are some things you find that are the same about these motions? What are some things you find that are different about these motions? 6. For the Sun and Earth system: a. Draw the path of the Earth with Gravity ON and Gravity OFF GRAVITY ON GRAVITY OFF b. What is the role of gravity in orbital motion? 7. Explore the simulation to find out how you can change the force of gravity and observe what happens, turn on the “Force of Gravity” button on the right side of the simulation. Draw the Sun’s gravitational pull on the Earth Draw the Earth’s gravitational pull on the Sun 8. Why do you think the Earth moves, but the Sun does not move very much? 9. Return to your pictures in Question 5 and add arrows to show the force of gravity. Label them with “Gravity Force”. 10. Play with the sim to find ways to change the length of the blue gravity force arrows. Collect your results in the table below. a) Fill in an ACTION below and write whether or not the gravitational force increases or decreases. ACTION Gravity Force Increases Gravity Force Decreases Put star and planet closer together b) What can affect the strength of gravitational force? What can you conclude from the results in your table? 11. Comparisons: a) Compare these two cases: CASE 1 CASE 2 What was changed between Case 1 and Case 2? Draw an arrow showing the force of gravity on the Earth in each case. b) Compare these two cases: CASE 1 CASE 2 What was changed between Case 1 and Case 2? Draw the force of gravity on the Earth in each case. 12. Fill in the table to help describe what you find out. How can you…. ...make the Moon go around the Earth in a bigger circle? ...make the Earth take more time to go around the Sun? ...make the Earth take less time to go around the Sun? Explain what you changed Draw the motion paths What other changes do you notice? PART 3: Go to the My Solar System simulation at http://phet.colorado.edu/en/simulation/my-solarsystem Click on “Run Now!” and explore the simulation. Click the “Show Grid” box on the right of the screen. Drag the slider from “Fast” all the way over to “Accurate”. At the bottom, select “3” for the number of bodies. Then fill out the data table to look like this: 1. Click on “Start” and observe the motion, then answer the questions below. a. Which planet (inner or outer) travels the least distance to go around once? b. Which planet is going the fastest? c. Which planet has the shortest ”year”? d. About how many times does the inner planet go around while the outer planet goes around once? e. In our solar system, what is the name of the planet that goes the fastest? The slowest? 2. Click “Stop”, then click on the arrow next to “Select Preset” in the upper right of the screen, then scroll down and select “Ellipses”. Click “Start” and answer the following questions about the outer GREEN orbit relative to the yellow “sun”.. a. Where in its orbit is the planet going the fastest? Slowest? b. Where do you think gravity is the strongest? Weakest? c. Comets have orbits similar to this one. Where would you expect a comet to spend most of its time, near the Sun or far from the Sun? Why? 3. Click on the “2” by the number of bodies and fill in the data table to look like this: Notice the time output in the lower right of the screen. Click on “Start” and watch the small mass fall toward the large mass. Measure the time it takes to hit by clicking on “Stop” as soon as the small mass hits (the large mass will flash when they hit). Repeat the simulation by clicking on “Reset” until you are sure you have an accurate time. Record your time for three trials in the table below. a. Predict what will happen to the time it takes the small planet to fall into the large planet if we double the mass of the small planet. Write your prediction here. b. Change the mass of Body 2 from 1 to 2. Click “Start” and measure the time it takes to hit. Record it in the table below. Was your prediction right? c. Predict the time it will take for body 2 to hit the star if we change its mass from 2 to 3. Write your prediction here. d. Change the mass of Body 2 from 2 to 3. Click “Start” and measure the time it takes to hit. Record it in the table below. Was your prediction right? Planet Mass 1 Time Trial 1 Time Trial 2 Time Trial 3 2 3 e. Based on your results, should more massive objects fall to Earth faster than less massive objects? Why or why not? 4. Click “Reset” then de-select the “System Centered” check box on the right of the screen. Fill in the data table to look like this: a. This creates one big planet and one small planet. Predict which planet will move the most and what will happen after they collide below. b. Click “Reset” then click “Start” and observe. Was your prediction correct? What do they do after they collide? c. Click “Reset” then change the 50 mass planet to 400 so they are equal. Predict what will happen below. d. Now click “Start” and observe. Was your prediction correct? What do they do after they collide? e. Click “Reset” then change the x velocity of planet 1 (yellow) to 100. Predict what will happen after they collide. f. Click “Start” and observe. Was your prediction correct? What do they do after they collide? 5. Using Select Preset, select “Sun and Planet”. Then select System centered, Show Traces, and Show Grid. a. Describe the shape of the orbit. b. Describe how the distance and planet velocity (the red arrow) affect the shape of the orbit. c. Move the planet outward, and observe (and record) the orbital period (how long does it take for the planet to make one complete revolution around the sun). Make a graph of distance (from the star) vs. period of orbit. (Use the graph paper on next page). Distance of Planet from the Sun Orbital Period d. What happens to the period as the star-planet increases? Why do you think there is a relationship? e. Using Select Preset, select “Ellipses”. Run the simulation. Observe planet orbital speed as a function of distance from the star. Describe what you see as quantitatively as you possibly can. f. Look up Kepler’s 3 laws (p. 607 in textbook or online). Record each law in the space below and describe how this simulation helps to demonstrate these laws: i. ii. iii. 6. Astronomers believe that terrestrial planets in binary star system could not support advanced life. (hint: Dole (1964) estimated that the average amount of energy received by a planet not could vary by more than 10 % without affecting its habitability). Use this computer simulation to test this hypothesis. Carefully describe the initial conditions of the simulation, your observations, and conclusions that support or refute this hypothesis.
