Moisture Lab Stations #1 – Just Dew It
advertisement
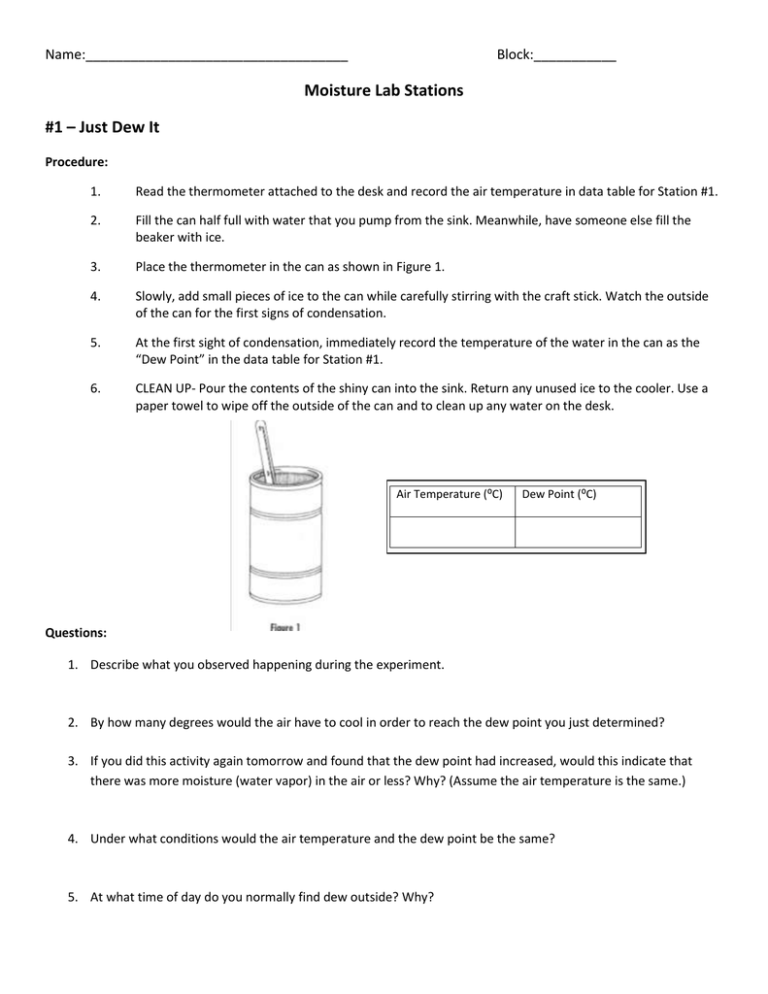
Name:___________________________________ Block:___________ Moisture Lab Stations #1 – Just Dew It Procedure: 1. Read the thermometer attached to the desk and record the air temperature in data table for Station #1. 2. Fill the can half full with water that you pump from the sink. Meanwhile, have someone else fill the beaker with ice. 3. Place the thermometer in the can as shown in Figure 1. 4. Slowly, add small pieces of ice to the can while carefully stirring with the craft stick. Watch the outside of the can for the first signs of condensation. 5. At the first sight of condensation, immediately record the temperature of the water in the can as the “Dew Point” in the data table for Station #1. 6. CLEAN UP- Pour the contents of the shiny can into the sink. Return any unused ice to the cooler. Use a paper towel to wipe off the outside of the can and to clean up any water on the desk. Air Temperature (⁰C) Dew Point (⁰C) Questions: 1. Describe what you observed happening during the experiment. 2. By how many degrees would the air have to cool in order to reach the dew point you just determined? 3. If you did this activity again tomorrow and found that the dew point had increased, would this indicate that there was more moisture (water vapor) in the air or less? Why? (Assume the air temperature is the same.) 4. Under what conditions would the air temperature and the dew point be the same? 5. At what time of day do you normally find dew outside? Why? 6. Where did the water on the outside of the can come from? #2: Let’s Make Frost Procedure: 1. Read the thermometer attached to the desk and record the air temperature in data table for Station #2. 2. Fill the shiny can halfway with ice from the cooler. Meanwhile, have someone else get one premeasured cup of salt. 3. Pour the salt into the can. Use the craft stick to mix the ice and salt. 4. Use the craft stick to make a hole in the middle of the ice and place the thermometer in the middle of the ice. 5. Watch the can carefully for the first appearance of frost. When it appears, note the temperature of the ice/salt mixture in the data table for Station #2. 8. CLEAN UP-Pour the ice/salt mixture into the sink. Use a paper towel to wipe off the outside of the can and to clean up any water on the desk. Air Temperature (⁰C) Data Table Ice/Salt Mixture Temperature at Frost Formation (⁰C) Questions: 1. Where did the moisture come from that formed the frost crystals on the can? 2. Why did the moisture deposit first as crystals of frost rather than condense as drops of water? 3. Based on your observations today and elsewhere, how are frost and dew alike? How are they different? 4. Why is it incorrect to say that frost is frozen dew? (Think about the phase change involved.) #3 – It’s All Relative Procedure: 1. Obtain a thermometer from the basket labeled “Unused”. Make sure it is the same temperature as the thermometer taped to the desk. 2. Record the temperature from the thermometer taped to the desk as the “Dry Bulb Temperature” in the Station #3 data table. 3. Take a small piece of paper towel and dip it in the water to make it wet. Wrap the wet paper towel around the end of the loose thermometer. 4. Tape the thermometer firmly to desk using the masking tape. Use rolls of tape on the back of the thermometer like the other thermometer. 5. Use the folder to fan the wet thermometer. Allow at least 2 members of the group to give this a try. Continue to fan until the temperature no longer drops. Record this temperature as the “Wet Bulb Temperature” in the Station #3 data table. 6. Find the difference between the dry bulb and wet bulb temperature and record this is as “difference”. 7. Use the table to find the Relative Humidity using the difference and the wet bulb temperature 8. CLEAN UP-Take the wet bulb thermometer off the desk and throw away the tape and paper towel. Place the thermometer that had the paper towel on it in the basket labeled “used”. Use a paper towel to clean up any water. Data Table Dry Bulb Temp. (C) Wet Bulb Temp. (C) Difference (C) Relative Humidity (%) Questions: 1. What did you notice about the wet bulb temperature as you fanned the thermometer? How can you explain what you observed? 2. Would the temperature of the wet bulb thermometer drop if the room had 100% relative humidity? Why or why not? #4 – It’s Just a Phase Procedure: 1. Read the statements below and label all of the arrows on the diagram with the appropriate phase change. Freezing is labeled for you. • Freezing occurs when a liquid changes to a solid. • Melting occurs when a solid changes to a liquid. • Evaporation occurs when a liquid changes to a gas. • Condensation occurs when a gas changes into a liquid. • Sublimation occurs when a solid changes directly to a gas. • Deposition occurs when a gas changes directly to a solid. 2. During a phase change, energy is either released or absorbed. When it is released, it will warm the surrounding air. When it is absorbed, it will cool the surrounding air. This is called latent heat. a. Color the counterclockwise arrows red indicating that latent heat is released causing warming. b. Color the clockwise arrows blue indicating that latent heat is absorbed causing cooling. Questions: 1. What type of phase change occurs during the formation of dew? Would this cause latent warming or cooling? 2. What type of phase change is the formation of frost? Would this cause latent warming or cooling? 3. Right after you get out of the pool, the water immediately begins to change from the liquid to a gas. What type of phase change is this? 4. Explain why you feel cold after stepping out of the pool.
