file - Athens Academy
advertisement
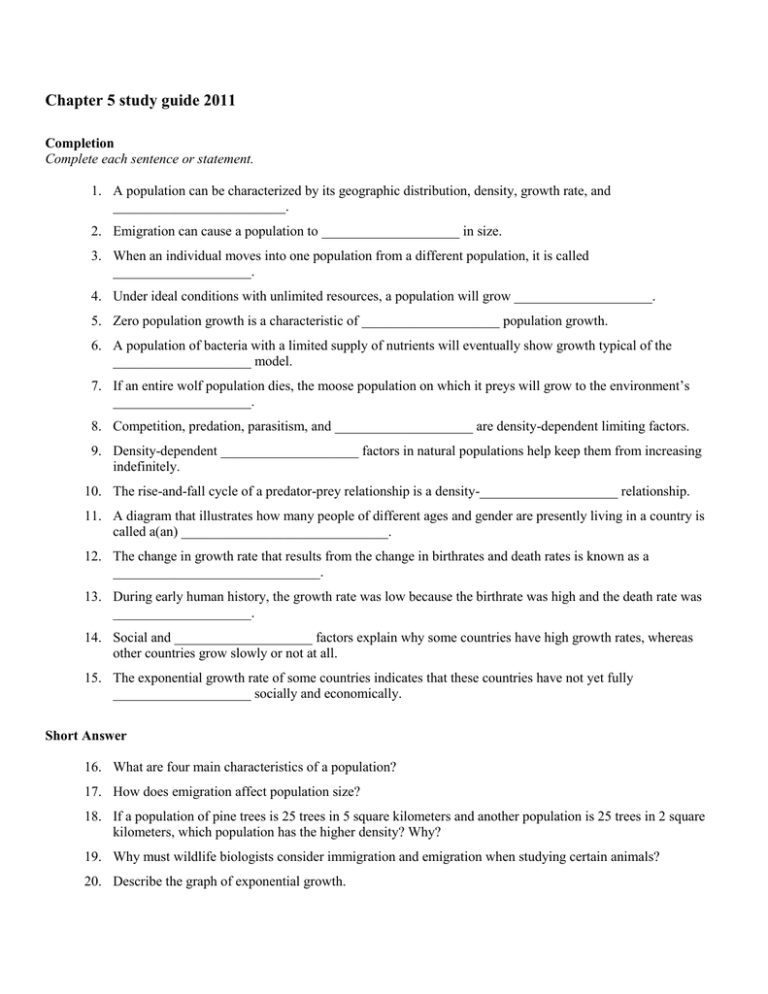
Chapter 5 study guide 2011 Completion Complete each sentence or statement. 1. A population can be characterized by its geographic distribution, density, growth rate, and _________________________. 2. Emigration can cause a population to ____________________ in size. 3. When an individual moves into one population from a different population, it is called ____________________. 4. Under ideal conditions with unlimited resources, a population will grow ____________________. 5. Zero population growth is a characteristic of ____________________ population growth. 6. A population of bacteria with a limited supply of nutrients will eventually show growth typical of the ____________________ model. 7. If an entire wolf population dies, the moose population on which it preys will grow to the environment’s ____________________. 8. Competition, predation, parasitism, and ____________________ are density-dependent limiting factors. 9. Density-dependent ____________________ factors in natural populations help keep them from increasing indefinitely. 10. The rise-and-fall cycle of a predator-prey relationship is a density-____________________ relationship. 11. A diagram that illustrates how many people of different ages and gender are presently living in a country is called a(an) ______________________________. 12. The change in growth rate that results from the change in birthrates and death rates is known as a ______________________________. 13. During early human history, the growth rate was low because the birthrate was high and the death rate was ____________________. 14. Social and ____________________ factors explain why some countries have high growth rates, whereas other countries grow slowly or not at all. 15. The exponential growth rate of some countries indicates that these countries have not yet fully ____________________ socially and economically. Short Answer 16. What are four main characteristics of a population? 17. How does emigration affect population size? 18. If a population of pine trees is 25 trees in 5 square kilometers and another population is 25 trees in 2 square kilometers, which population has the higher density? Why? 19. Why must wildlife biologists consider immigration and emigration when studying certain animals? 20. Describe the graph of exponential growth. 21. What is a limiting factor? Give two or three examples. 22. What is a density-independent limiting factor? Give two or three examples. 23. What are some factors that keep a population from growing further once it reaches the carrying capacity of its environment? 24. What kept the human growth rate low before the Industrial Revolution? 25. How can a demographer, or scientist who studies demography, predict how a population will change in the future? Other USING SCIENCE SKILLS Population Statistics in the United States From 1900 to 1990 1900 1910 1920 1930 1940 1950 1960 1970 1980 1990 Live births per thousand 32.3 30.1 27.7 21.3 19.4 24.1 23.7 18.4 15.9 15.6 Deaths per thousand 17.1 14.7 13.0 11.3 10.8 9.6 9.5 9.5 8.8 8.7 Number of births over deaths 15.2 15.4 14.7 10.0 8.6 14.5 14.2 8.9 7.1 6.9 Life expectancy at birth (yrs) 47.3 50.0 54.1 59.7 62.9 68.2 69.7 70.8 73.7 74.8 2.7 6.8 12.4 15.6 20.9 22.4 23.5 26.4 27.5 Increase in longevity since 1900 (yrs) Figure 5–1 26. Using Tables and Graphs According to Figure 5–1, which year had the highest number of live births per thousand of population? 27. Drawing Conclusions Examine the data in Figure 5–1. Does the number of births over deaths since 1950 increase or decrease? 28. Applying Concepts Examine the data for life expectancy at birth in Figure 5–1. Over the period of time covered by the data, the death rate decreased steadily and the birthrate has declined since 1950. What factor is responsible for the fact that our population is not decreasing? USING SCIENCE SKILLS Graph I shows the growth curve for a culture of Paramecium aurelia. Graph II shows the growth curve for a culture of Paramecium caudatum, a larger species. Graph III shows the growth curves of both species when they are grown together. Figure 5–2 29. Drawing Conclusions What is the most likely explanation for the decline of the P. caudatum shown in Graph III of Figure 5–2? 30. Drawing Conclusions Are the limiting factors for all cultures in Figure 5–2 density-dependent or densityindependent? Explain. USING SCIENCE SKILLS Figure 5–3 31. Comparing and Contrasting Using Figure 5–3, compare the human population growth of Mexico with that of the United States. 32. Predicting Using the age structure diagrams in Figure 5–3, what type of growth can the United States expect in the near future? Explain your answer. 33. Using Models What evidence do you see in Figure 5–3 that the United States is gradually entering the last stage of demographic transition?
