Effects on patients' experiences - Guildford Parkinson's Disease

INTRODUCTION
Objectives
• Devise conceptual framework for system features impacting patients’ experiences.
• Report on a pilot study of experiences of people with Parkinson’s disease in different systems.
Background
•
All heath care systems are seeking reforms to increase efficiency and contain costs.
• National systems are isolated natural experiments in finance and delivery. [1]
• Many questions about relative quality and efficiency require detailed analyses of specific health problems. [2]
• International disease-level studies care hindered by problems of data comparability and deficiencies.
• Two studies confirm the impact of system factors on routine treatment:
A comparison of the experiences of patients with diabetes, breast cancer, lung cancer and cholelithiasis in Germany, the UK and the USA observed:
“surprising large differences in … treatment and use of technology … despite similar clinical training and expertise.” [3]
OECD Age Related Diseases Project found outcome and utilization differences among patients with ischemic heart disease, breast cancer and stroke among more than 20 counties:
“… features of the health care system have multiple and pervasive effects on the amount and type of treatment through the continuum of care” and
“… provider payment plays a key role and requires more analysis.”
[1]
References
1. OECD. A Disease-Based Comparison of Health Systems 2003 .
2. Huber M, Orosz E. Health Expenditure Trends in OECD countries 1990-2001. Healthcare Financing Review , Fall
2003, 25(1), 1-21.
3. McKinsey Health Care Practice. Health Care Productivity. Los Angeles. Oct 1996.
4. Kutzin J. A Descriptive Framework for Country Level Analysis of Health Care Financing Arrangements. Health
Policy , 2001, 56, 171-204.
5. Mossialos E, Dixon A, Figueras J, Kutzin J (editors). Funding Health Care: Options for Europe . European
Observatory on Health Care System Series. Open University Press 2002.
6. Normand C, Busse R. Social Health Insurance Financing. Chapter 3 in Mossialos E, Dixon A, Figueras J, Kutzin
J (editors). Funding Health Care: Options for Europe . pp 59-79.
7. Mossialos E, Thomson S. Voluntary Health Care Insurance in the European Union. Chapter 6 in Mossialos E,
Dixon A, Figueras J, Kutzin J (editors). Funding Health Care: Options for Europe . pp 128-160.
8. Robinson R. User Chargers for Health Care. Chapter 7 in Mossialos E, Dixon A, Figueras J, Kutzin J (editors).
Funding Health Care: Options for Europe . pp 161-183.
9. Eggleston K, Hsieh C-R. Health Care Payment Incentives: A Comparative Analysis of Reform in Taiwan, South
Korea and China. Applied Health Economics and Health Policy . 2004, 3(1), 47-56.
10. Simeons S, Giuffrida A. The Impact of Physician Payment Methods on Raising the Efficiency of the Health Care
System: An International Comparison. Applied Health Economics and Health Policy . 2004, 3(1), 39-46.
11. Gosden T, Pedersen L, Torgerson D. How Should We Pay Doctors? A Systematic Review of Salary Payments and the Effect on Doctor Behavior. Quarterly Journal of Medicine, 1999, 92, 47-55.
12. Gosden T, Forland F, Kristiansen IS, Sulton M, Lease B, Giuffrida A, Sergison M, Pedersen L. Impact of
Payment Method on Behavior of Primary Care Physicians: A Systematic Review. Journal of Health Service
Research and Policy , 2001, 6(1), 44-55.
13. Kuhn M. Quality in Primary Care Economic Approaches to Analyzing Quality-Related Physician Behavior .
Office of Health Economics, 2003, London.
14. Thompson C, McKee M. Financing and Planning of Public and Private Not-for-profit Hospitals in European
Union. Health Policy , 2004, 67, 281-291.
15. Rice N, Smith PC. Strategic Resource Allocation and Funding Decisions. Chapter 11 in Mossialos E, Dixon A,
Figueras J, Kutzin J (editors). Funding Health Care: Options for Europe . pp 250-271.
16. Lewis M. Informal Health Payments in Central and Eastern Europe and the Formal Soviet Union: Issues,
Treads and Policy Implications. Chapter 8 in Mossialos E, Dixon A, Figueras J, Kutzin J (editors). Funding Health
Care: Options for Europe . pp 184-205.
17. Preker AS, Jackab M, Schneider M. Health Financing Reforms in Central and Eastern Europe and the Formal
Soviet Union. Chapter 4 in Mossialos E, Dixon A, Figueras J, Kutzin J (editors). Funding Health Care: Options for
Europe . pp 80-108.
Acknowledgements : Lesley Storey for assistance with interviewing
Alan Bird, Yumiko S and Philip Qiao for assistance with poster preparation
National Parkinson’s society representatives for participating in interviews
FINANCING OF HEALTHCARE SYSTEMS use different blends of public and private funds.
5000
4000
3000
2000
1000
0
Public expenditure on health Private expenditure on health
In highest health care spending OECD countries where data are available. Expenditures per capita US $ PPP 2001.
Public funding predominantly from taxation or social insurance.
• Tax based (Beveridge) systems may use revenue from general or hypothecated taxes.
• Social insurance (Bismarck) may be based on income or employment; may comprise competing insurers.
3000
2500
2000
1500
1000
500
0
Au st ra lia
Au st ria
C an ad a
D en m ar k
Fi nl an d
Fr an ce
G er m an y
Ire la nd
Ita ly
Lu xe m bo ur g
N et he rla nd s
N ew
Z ea la nd
N or w ay
Sp ai n
Sw itz er la nd
U ni te d
Ki ng do m
U ni te d
St at es
General government expenditure Social insurance
In highest health care spending OECD countries w here data are available. Expenditures per capita in US $ ppp 2001.
Effects on patients’ experiences
• Progressively of tax/ social insurance affects equity and efficiency.
• General taxation funding affects other public services; global budgets may reduce available technology. [1]
• Easier to fund with hypothecated taxes and social insurance: more transparent; less political interference.
• Employment based schemes may affect labour market.
• Social insurance schemes have evolved and survived suggesting sustainability. [6]
• Consumer choice and competition may reduce costs and increase responsiveness to consumer preference.
Private expenditures private medical insurance (PMI out-of-pocket payments) significant in many countries
PMI as percentage of total health expenditure 2001.
10
5
0
40
35
30
25
20
15
A us tr ia
C an ad a
D en m a rk
F in la nd
F ra nc e
G er m an y
Ita ly
N et he rl an ds
N ew
Z ea la nd
S pa in
S w itz er la nd
U ni te d
S ta te s
OECD countries are included w here data are available.
PMI may be:
• substitute for public scheme
• complement to cover
“gaps” in public scheme
• supplement public scheme e.g. for hospital upgrades
PMI tends to be regressive, i.e. accessible mainly to higher income people
CONCEPTUAL FRAMEWORK
GENERIC HEALTH CARE SYSTEM MODEL
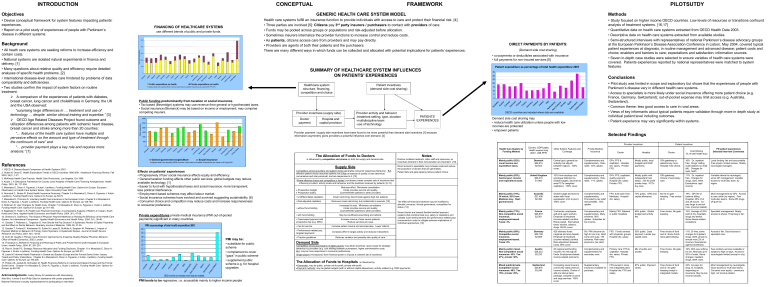
Health care systems fulfill an insurance function to provide individuals with access to care and protect their financial risk. [4]
• Three parties are involved [5]:
Citizens pay 3 rd party insurers / purchasers to contact with providers of care.
• Funds may be pooled across groups or populations and risk-adjusted before allocation.
• Sometimes insurers internalize the provider functions to increase control and reduce costs.
• As patients, citizens access care from providers and may pay directly.
• Providers are agents of both their patients and the purchasers.
There are many different ways in which funds can be collected and allocated with potential implications for patients’ experiences.
SUMMARY OF HEALTHCARE SYSTEM INFLUENCES
ON PATIENTS’ EXPERIENCES
Healthcare system structure, financing, competition and choice
Patient incentives
(demand side cost sharing)
Provider incentives (supply side)
Doctor payment
Hospital and capital provision
Provider activity and behavior
treatment setting, type, duration
multidiscipline team
use of technology
PATIENTS’
EXPERIENCES
Provider payment / supply side incentives have been found to be more powerful than demand side incentives [1] because information asymmetry gives providers a powerful influence over demand. [4]
The Allocation of Funds to Doctors is influenced by competition and choice on both the supply and demand side.
Supply Side
Competition among providers and patient choice generates consumer responsive behaviour. But, effective patient choice assumes patients can judge all aspects of quality of care (technical, convenience and inter-personal), and are responsive to it. [13]
Where effective choice and competition is limited, purchasers create complex sets of incentives that influence providers’ activity levels and behaviour and the treatment received by patients. [9-13]
Prospective budget
Prospective salary
• Undifferentiated capitation
• Risk-adjusted capitation
Reduces effort. Minimises consultation.
Under-provides service and quality.
Cost-shift/refer patients to other providers.
Cream skimming, discriminate against high-risk patients.
Removes cream-skimming, but problematic to execute. [15]
• without fund-holding
• with fund-holding
• Case-based payment with prospective fee (e.g. DRG)
• Fee for service
• Performance-related pay, targeted payments
• Practice guidelines
Increases list size. Minimises consultation.
Under-provides service and quality.
Cost-shift/refer patients to other providers.
May be insufficient prescribing and referral.
Increase volume of less severe patients.
Reduce services per case.
Increase patient volume and services/case. Lower referral.
Increases effort in target activity and reduces it elsewhere.
Reduces variation and possibly also quality of care.
Demand Side
Competition among purchasers (multiple-payers) may dilute incentives, leave scope for strategic behaviour by providers (e.g. cost shifting between purchasers), higher administrative costs.
But, may be more responsive to consumer preferences.
Single-payers (monopsony) have financial power to impose a coherent set of incentives.
Notes
Doctors mobilise treatment, other staff and resources, so incentives inherent in their remuneration are important. [10]
Direct access to specialists may increase costs and reduce the proportion of doctors that are generalists.
Patient lists and gate-keeping reduce patient choice.
The effect of financial incentives may be modified by altruistic concerns, clinical governance, competition for status. [13]
Recent trends are towards flexible blended payment systems that combine fixed (e.g. salary or capitation) and variable (cost reimbursement and performance related pay) components in order to mitigate adverse implications of individual approaches. [10]
The Allocation of Funds to Hospitals is influenced by:
Ownership: may be public, private not-for-profit, private with-profit.
Payment methods: may be global budgets (with or without capital allowances), activity-related (e.g. DRG payments).
DIRECT PAYMENTS BY PATIENTS:
(Demand side cost sharing)
• co-payments or deductibles associated with insurance
• full payments for non-insured services [8]
15
10
5
0
35
30
25
20
Patient expenditure as percentage of total health expenditure 2001
PILOTSUTDY
Methods
•
Study focused on higher income OECD countries. Low levels of resources or transitions confound analysis of treatment systems. [16,17]
• Quantitative data on health care systems extracted from OECD Health Data 2003.
• Descriptive data on health care systems extracted from available studies.
• Semi-structured interviews with representatives of national Parkinson’s disease advocacy groups at the European Parkinson’s Disease Association Conference in Lisbon, May 2004, covered typical patient experiences at diagnosis, in routine management and advanced disease; patient costs and choice; enablers and barriers to care; expectations and satisfaction; information sources.
• Seven in-depth case studies were selected to ensure varieties of health care systems were covered. Patients experiences reported by national representatives were matched to system features.
Conclusions
•
Pilot study was limited in scope and exploratory but shows that the experiences of people with
Parkinson’s disease vary in different health care systems.
• Access to specialists is more likely under social insurance offering more patient choice (e.g.
France, Germany, Switzerland); out-of-pocket expense may limit access (e.g. Australia,
Switzerland).
• Common theme: less good access to care in rural areas.
• Views of key informants about typical patients require validation through more in depth study at individual patient level including outcomes.
• Patient experience may vary significantly within systems.
OECD countries are included where data are available
Demand side cost sharing may
• reduce health care utilization unless people with low incomes are protected
• empower patients
Selected Findings
Health Care System by
Funding Method
Country: GDP/capita,
Health expend./cap
(2001, US$ PPP)
Mainly public (82%).
Local income and expenditure taxes.
Mainly public (82%).
Central govt: income and expenditure taxes.
Denmark
$29,216
$2,503
United Kingdom
$26,315
$1,992
Other System Features and
Coverage
Private Medical
Insurance
Doctor
Provider Incentives
Hospital Choice
Patient Incentives
Cost-Sharing
(% of total health exp)
PD patient experiences
Selected Interview Comments
Central govt. general tax subsidy risk adjusts between regions. 100% cover.
Complementary and supplementary. Riskrated. 30% uptake.
GPs: FFS & capitation. Hospital drs: salary. Private:
FFS.
Mostly public: local budgets and DGR payments.
10% from employer and employee National Ins.
Global budgets, devolved to area PCTs (weighted capitation). 100% cover.
Complementary and supplementary. Riskrated. 11% uptake.
GPs: FFS, capitation, quality payment.
Hospital drs: salary.
Private: FFS.
Mostly public with independent trust status. 230 for profit private hosp. PCTs buy care.
GPs gatekeep or patients pay more.
Hospital: free choice.
GPs gatekeep.
Choice of secondary care.
16%. Dr, inpatient free. Drugs: sliding scale (depend on total bill). Charges for eyes, teeth.
11%. Dr, inpatient free. Charges for drugs, eyes, teeth.
Exemptions: age/ income.
Local funding: fair and accountable.
Free physio: limited access. Mostly neurologist-managed.
Variable referral to neurologist, some GP management. Variable access to multi-disc team, by region.
Mainly public (70%).
Of which, 20% from
Medicare levy. Rest: general taxes.
Mainly public (73%).
Non-competitive social insurance, employment-based.
Taxes: 3%.
Mainly public (69%).
Competitive social insurance, employment-based.
Taxes: 6%.
Mainly public mixed.
Non-competitive social insurance: 43%. Tax:
27%; private: 30%.
Mixed public/private.
Competitive social insurance: 40%. Tax:
15%; private: 45%.
Australia
$27,408
$2,350
France
$26,879
$2,561
Germany
$26,199
$2,808
Austria
$28,323
$2,233
Switzerland
$29,876
$3,248
Global budget devolved to states with fiscal equalisation (rich to poor).
100% cover.
3 schemes: employees, self-emp, agric workers.
Employer & employee
(income-related) contribs.
Risks pooled. Earmarked taxes: alcohol, tobacco, drugs. 99.9% cover.
420 sickness funds
(regional and emp-based).
Employer & employee
(income-related) contribs.
Risk adjustment between funds. 90% cover
20 regional self-funding insurers. No risk adj btn funds. Employment-based, income-related premiums.
Competing social insurers community-rated premium.
Income subsidy. Choice of add-ons above basic package, compete on price and supp services. 100% cover.
Complementary and supplementary.
Promoted by tax relief and penalties. 50% uptake.
Complementary and supplementary. Many schemes. 90% uptake. Subsidies for low income.
9%: PMI (income too high for soc ins). Rest: comp and supp. >50 schemes. Risk-rated premiums, tax relief.
Complementary and supplementary for secondary care.
FFS, bulk claim from
Medicare. Hospital drs: salary.
Mainly FFS. Salaries in public hospitals.
FFS. Funds contract with physician groups.
Hospital drs: salary.
Primary care: FFS & capitation. Hospital drs: salary. Private:
FFS.
Supplementary insurance available for purchase.
FFS except in some new integrated plans.
Hospital drs: FFS and salary.
70% public. DRG and capital allowance.
No list or gatekeeping. Free choice of dr.
65% public. Global budget and activity fee.
55% public. Case payment. Lander pay capital costs.
Mix of public and private.
67% public. Payment varies.
Free choice. No gatekeeping.
Free choice of fund and dr. Some funds have gate-keeping.
Free choice. No gatekeeping.
Free choice of fund and dr. No gatekeeping except in integrated models.
19%. GP free or balance billing.
Hospital: 25% of dr and all accom. Copay drugs to annual max. (income related).
10%. Average of 25% paid of drs, hospitals, drugs and dental.
Some illness-related exceptions.
Most management by GPs. Access to care unfair (by region). Few multi-disc teams. Some PD drugs off govt list.
Specialist management. Ready access to physio. Financing is fair.
11%. Dr free, some charges for inpatient, drugs, teeth, physio to annual max (2% of income). Exemptions: age/income/illness.
19%. 80% pay nothing for drs. Rest pay up to
20% of costs. Some charges: inpatient, drugs, teeth, eyes.
Access is fair. Good access to specialist care.
Few ancillary services available or subject to high co-pays. Access to neurologists limited (except in city).
33%. Co-pays for drug, dr, hospitals, depending on insurance. May be low income subsidy.
Most management by neurologists.
Good access to multi disc teams.
Concerns over equity – premiums high, not income related.


