Len Rodberg's slide show (). - Healthcare-NOW!
advertisement
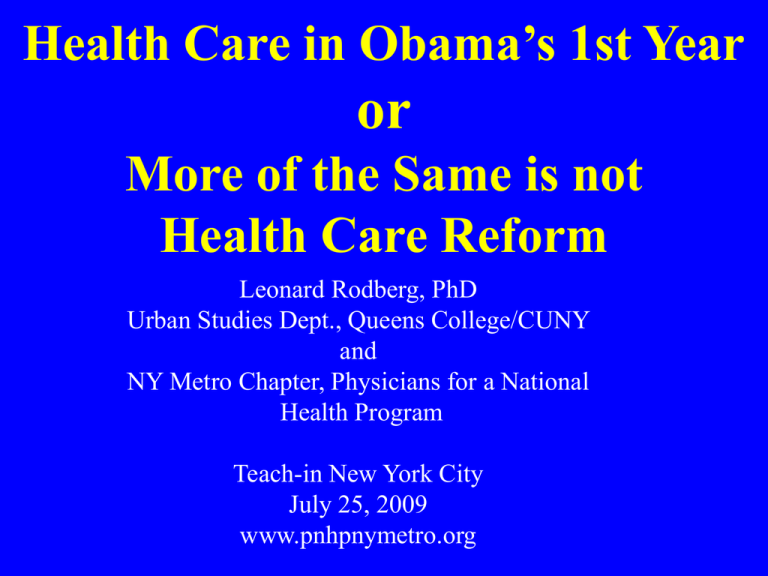
Health Care in Obama’s 1st Year or More of the Same is not Health Care Reform Leonard Rodberg, PhD Urban Studies Dept., Queens College/CUNY and NY Metro Chapter, Physicians for a National Health Program Teach-in New York City July 25, 2009 www.pnhpnymetro.org Why Health Care Is On the Agenda: Escalating Cost Average Annual Premiums for Single and Family Coverage, 1999-2008 $2,196 1999 $2,471 2000 $7,061 $3,083 2002 Family Coverage $6,438 $2,689 2001 Single Coverage $5,791 $8,003 $3,383 2003 $9,068 $3,695 2004 $9,950 $4,024 2005 $10,880 $4,242 2006 $11,480 $4,479 2007 $12,106 $4,704 2008 $0 $2,000 $4,000 $6,000 $12,680 $8,000 $10,000 Source: Kaiser/HRET Survey of Employer-Sponsored Health Benefits, 1999-2008. $12,000 $14,000 International Comparison: Universal Coverage at Less Cost -- They Must Be Doing Something Right! Average spending on health per capita ($US PPP*) $7,000 United States Germany Canada Netherlands France Australia United Kingdom $6,000 $5,000 $4,000 $3,000 $2,000 $1,000 20 06 20 04 20 02 20 00 19 98 19 96 19 94 19 92 19 90 19 88 19 86 19 84 19 82 19 80 $0 * PPP = Purchasing Power Parity. Data: OECD Health Data 2008, June 2008 version. None rely on private for-profit insurance, all have a strong role for government. High Cost of Health Insurance Premiums: Even the Middle Class Can No Longer Afford It National Average for Employer-provided Insurance: Single Coverage Family Coverage $ 4,704 per year $12,680 per year Median household income = $50,233 Source: Kaiser Family Foundation/HRET Survey of Employee Benefits, 2008; U.S. Census Bureau, 2008 The Epidemic of Underinsurance Number of people spending more than 10% of income on health care (Millions) 70 60 50 40 30 20 10 Insured Uninsured 0 2000 2007 Source: Too Great a Burden, Families USA, December 2007 Medical costs create serious financial problems for millions of us Source: Health Tracking Poll, Kaiser Family Foundation, April 2008 Health Care Costs Are Concentrated Among a Few People in Any One Year 80 70 60 Percent of Health Care Costs 50 This Year’s Underinsured 40 30 20 10 0 0% 10% 20% 30% 40% 50% 60% 70% 80% 90% Population by Decile in Health Care Costs Source: Medical Expenditure Panel Survey, US Agency for Healthcare Research and Quality, 1999 While millions are underinsured, millions more don’t think there’s a problem! The President’s Principles for Health Care Reform • Protect Families’ Financial Health…reduce growing premiums and other costs…protect from bankruptcy due to catastrophic illness. • Make Health Coverage Affordable... reduce high administrative costs, waste, inefficiencies. • Aim for Universality… put the United States on a clear path to cover all Americans. • Provide Portability of Coverage… not locked into their job just to secure health coverage. • Guarantee Choice… provide a choice of health plans and physicians… have the option of keeping their employer-based health plan. -- “A New Era of Responsibility,” President’s Budget, Feb. 26, 2009 The Progress of US Health Care Reform Employer mandate Individual mandate* * “each eligible individual must enroll in an applicable health plan for the individual and must pay any premium required with respect to such enrollment.” (S.1775) Public option** ** “you can choose to enroll in the new public plan” The Mandate Model • Everyone required to have insurance • Employers must offer insurance or contribute • Continued reliance on private insurance, with the option of a public plan • “Keep what you have” Doesn’t address underinsurance. • No regulation of insurance company premiums, deductibles, co-pays, or payment and denial practices • Increases the system cost by hundreds of billions of dollars • No cost savings or realistic way to control costs, as long as there are many separate plans and payers. The Obama/Congressional Plan • Employment-based insurance unchanged, so -- Employers can still change coverage -- Insurers can still change networks -- Employees still locked into jobs • Employees must accept employer plan if they can afford it (premium < 11% or 12.5% of income) • Starting in 2013, the uninsured can access an insurance “exchange” with subsidies up to 400% of the Federal poverty level • Public plan option available in the exchange • “Hardship waiver” for those who can’t afford it The Massachusetts Plan: Insurance Still Costly and Unaffordable Family Characteristics Annual Income 30-year old individual $31,212 or more 30-yr old couple w/2 children $63,612 or more 55-year old couple $42,012 or more Annual Cost Deductible* $2,459 $2,000 $8,900 $3,500 $10,476 $4,000 * Also physician & hospital co-pays Source: www.mahealthconnector.org (Boston Area, Jan 2009) Why a Public Option? • Provide stability, wide pooling of risks, transparency, affordability, broad provider access, source of data • Competitive benchmark to force private plans to reduce prices,improve coverage (“keep them honest”) • Lead in restraining costs and improving quality • Without it, there’s no reform, since there is no other change in the system Source: Jacob Hacker, Healthy Competition, Berkeley Law and Institute for America’s Future, April 2009, Howard Dean, Barack Obama Why Not a Public Option? From supporters of private insurance – • “Unfair competition” from government • Would undermine private insurance, use inherent powers of government to limit competition, underpay doctors and hospitals • Will eventually lead to “government-run” system From single payer supporters – • Private insurers will selectively market to the healthy (“adverse selection”) • Retains private insurance • Doesn’t get all the savings possible with single payer What Happened to the Public Plan? The Original “robust” Plan • Open enrollment • Medicare-like, backed by the Federal Government • 119 million members (Lewin) The Congressional Plan • Restricted enrollment (only the uninsured) • Self-sustaining, follow same rules as private insurers • Perhaps 10 million members (CBO) The 800-pound gorilla has turned into a mouse! What Will Control Costs under the Congressional Plan? • • • • Emphasis on prevention Computerization Chronic disease management Payment reforms (e.g., medical home, “bundling”) • Comparative effectiveness research The Congressional Budget Office says these will (1) not cut costs significantly and (2) not limit the continuing rise in cost. Covering the Uninsured and the Underinsured? $1 Trillion/seven years = $130 billion/yr Number of Uninsured Covered: 37 million Number of Uninsured Remaining: 17 million [ Source: Congressional Budget Office, Letter to Rep. Charles Rangel, July 17, 2009] Number of Underinsured: 50 million+ Even a Trillion dollars is not enough! Total cost of making health care affordable: $200-300 billion/year Single Payer can provide it! Senate Finance Committee Considers How to Pay for Health Care Reform Senate Finance Committee Considers How to Pay for HCR What’s on the table? New Taxes! Surtax on the wealthy Employer-based health insurance Hospitals Sodas Alcohol Tobacco What’s off the table? $400 Billion in savings from Single Payer Elimination of private for-profit insurance Savings in hospital and MD billing costs The Invisible Pot of Gold! $400B Will the Mandate Plan Pass? • Will business accept the mandate to provide coverage? • Will private insurance companies accept guaranteed issue and community rating? • Will conservatives accept the new taxes needed to fund the subsidies for the individual mandate? • Will the general public support a plan with a mandate to purchase insurance? The Bottom Line on the Congressional Plan If it does pass in some form, it would: • Make the world’s most expensive system even costlier. • Not achieve universal coverage • Not improve coverage for the average person. • Not make affordable insurance available. • Not contain the continuing growth in cost. • Not achieve President Obama’s goals. It doesn’t really reform the system. It just won’t work! Conyers: Expanded and Improved Medicare for All “single payer national health care” HR 676 • • • • • • • Automatic enrollment Comprehensive benefits Free choice of doctor and hospital Doctors and hospitals remain independent Public agency processes and pays bills Financed through progressive taxes Costs contained through capital planning, budgeting, primary care emphasis New – Sanders (& McDermott): American Health Security Act S 703 (HR 1200) 1.Automatic enrollment 2.Comprehensive benefits 3.Operated by States using Federal standards 4.Free choice of doctor and hospital 5.Doctors and hospitals remain independent 6.Public agency processes and pays bills 7.Financed through payroll taxes How We Pay for Health Care Today Private Insurance Private Insurance 34% 35% Federal Government Federal Government (existing Medicare, (existing Medicare, Medicaid, other) 33% Medicaid, other) 34% State and Local Govt (existing Medicaid, other) 13% Out of pocket State and Local Government Other private funds (charity, etc.) funds (existing Medicaid, other) 12% Other private 7% (charity, etc.) 13% 7% Source: Health Affairs, Feb. 2008; data for 2006 Out-of-pocket 12% How Single Payer Could Be Paid For: One Example from a Recent Study of a California Plan Employer Payroll Tax (8%) Employee Payroll Tax (4%) Surcharge on income (1% above $200,000) Federal Government (existing Medicare, Medicaid, other) State and Local Govt (existing Medicaid, other) Business (selfemployed) income tax (12% ) Investment income tax (4% ) Note: Payroll and income taxes between $7,000 and $200,000 only. Source: Health Care for All Californians Act: Cost and Economic Impacts Analysis, The Lewin Group, January 2005 Billing and Insurance: Nearly 30% of All Health Care Spending Allocation of Spending for Hospital and Physician Care Paid through Private Insurers Other Insurer Costs and Profit 11% Insurer Billing 8% Hospital Billing 4% Medical Care 64% 28% Physician Billing 5% Medical Care Administration 9% Source: James G. Kahn et al, The Cost of Health Insurance Administration in California: Estimates for Insurers, Physicians, and Hospitals, Health Affairs, 2005 Covering Everyone with No Additional Spending Additional costs Covering the uninsured and poorly-insured Elimination of cost-sharing and co-pays Total Costs Savings Reduced hospital administrative costs Reduced physician office costs Reduced insurance administrative costs Bulk purchasing of drugs & equipment Primary care emphasis & reduce fraud Total Savings Net Savings +6.4% +5.1% +11.5% -1.9% -3.6% -5.3% -2.8% -2.2% -15.8% - 4.3% Source: Health Care for All Californians Plan, Lewin Group, January 2005 $B 134 107 241 -21 -76 -111 -59 -46 -313 - 73 Single payer offers real tools to contain costs • Budgeting, especially for hospitals • Capital investment planning • Emphasis on primary care, coordination of care, and alternative ways of paying for services • Bulk purchasing Conclusions • • • • A system based on private insurance will never lead to universal coverage, nor can it control costs Only single payer can provide comprehensive services while costing no more than we now spend. Only single payer can control costs going into the future. If a mandate plan is passed, the problems of the health care system will not go away. Real health care reform will continue to be essential. We don’t need more money. We need a new system. -- Arnold Relman & Marcia Angell We Can’t Wait Another 16 Years! Will We Get Real Health Care Reform Before the Premium Takes All our Income? Today Source: American Family Physician, November 14, 2005
