Appendix Table 1: ICD-9 and CPT Categories
advertisement
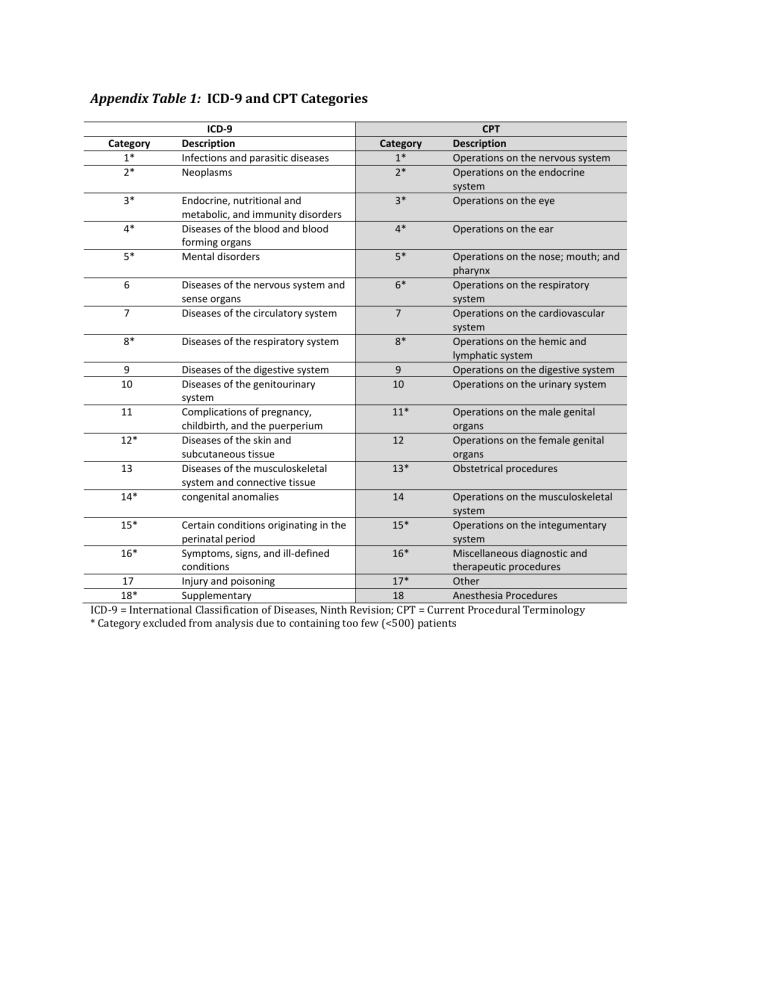
Appendix Table 1: ICD-9 and CPT Categories Endocrine, nutritional and metabolic, and immunity disorders Diseases of the blood and blood forming organs Mental disorders 3* CPT Description Operations on the nervous system Operations on the endocrine system Operations on the eye 4* Operations on the ear 5* 6* 7 Diseases of the nervous system and sense organs Diseases of the circulatory system 8* Diseases of the respiratory system 8* 9 10 Diseases of the digestive system Diseases of the genitourinary system Complications of pregnancy, childbirth, and the puerperium Diseases of the skin and subcutaneous tissue Diseases of the musculoskeletal system and connective tissue congenital anomalies 9 10 Operations on the nose; mouth; and pharynx Operations on the respiratory system Operations on the cardiovascular system Operations on the hemic and lymphatic system Operations on the digestive system Operations on the urinary system Category 1* 2* 3* 4* 5* 6 11 12* 13 14* ICD-9 Description Infections and parasitic diseases Neoplasms Category 1* 2* 7 11* 12 13* 14 Operations on the male genital organs Operations on the female genital organs Obstetrical procedures Operations on the musculoskeletal system 15* Certain conditions originating in the 15* Operations on the integumentary perinatal period system 16* Symptoms, signs, and ill-defined 16* Miscellaneous diagnostic and conditions therapeutic procedures 17 Injury and poisoning 17* Other 18* Supplementary 18 Anesthesia Procedures ICD-9 = International Classification of Diseases, Ninth Revision; CPT = Current Procedural Terminology * Category excluded from analysis due to containing too few (<500) patients Appendix Table 2: Zero-inflated Poisson regression with healthy pregnant women excluded (n=5242) Laboratory Results Medication Orders Overall Ratio of Overall Ratio of variable expected Regression variable expected Regression Variable Variable value effect number p-value effect number p-value p-value of days* p-value of days* ASA Class <.001† <.001† 1 1.00 1.00 2 1.80 <.001† 2.39 <.001† 3 3.94 <.001† 5.10 <.001† 4 5.47 <.001† 6.82 <.001† Sex 0.090 0.004† Female 1.00 1.00 Male 0.97 0.090 0.93 0.004† Age <.001† <.001† 0.997 <.001† 0.997 <.001† Emergency Status <.001† <.001† Non-emergent 1.00 1.00 Emergent 0.66 <.001† 0.66 <.001† Admission Status <.001† <.001† Outpatient 1.00 1.00 Same Day 0.88 <.001† 0.83 0.007† Inpatient 1.70 <.001† 1.35 <.001† ICD-9 Category <.001† <.001† 2 1.00 1.00 6 1.35 0.032 0.62 0.001† 7 0.42 <.001† 0.43 <.001† 9 1.04 0.271 0.95 0.334 10 1.30 <.001† 1.35 <.001† 11 0.97 0.707 0.64 <.001† 13 0.90 0.087 1.03 0.64 17 0.79 <.001† 0.78 <.001† CPT Category <.001† <.001† 3 1.00 1.00 7 1.86 <.001† 0.72 0.020† 9 1.22 0.163 0.64 0.002† 10 0.91 0.534 0.38 <.001† 12 1.03 0.860 0.44 <.001† 14 1.15 0.298 0.54 <.001† 18 2.23 <.001† 0.82 0.278 *The effects are ratios, obtained by exponentiating the model regression coefficients, of the expected number of days (with either laboratory results or medication orders) for each level of a variable compared to the reference level (first row) of that variable, that is, an effect of 2.0 for ASA 3 indicates that ASA 3 is estimated to have 2 times the number of days as ASA 1. For the “Age” variable the ratio represent the estimated change with in the number of days with each additional year. †Statistically significant at the 0.05 significance level


