Table 1. Characteristics of the 133 patients with ESRD with and
advertisement
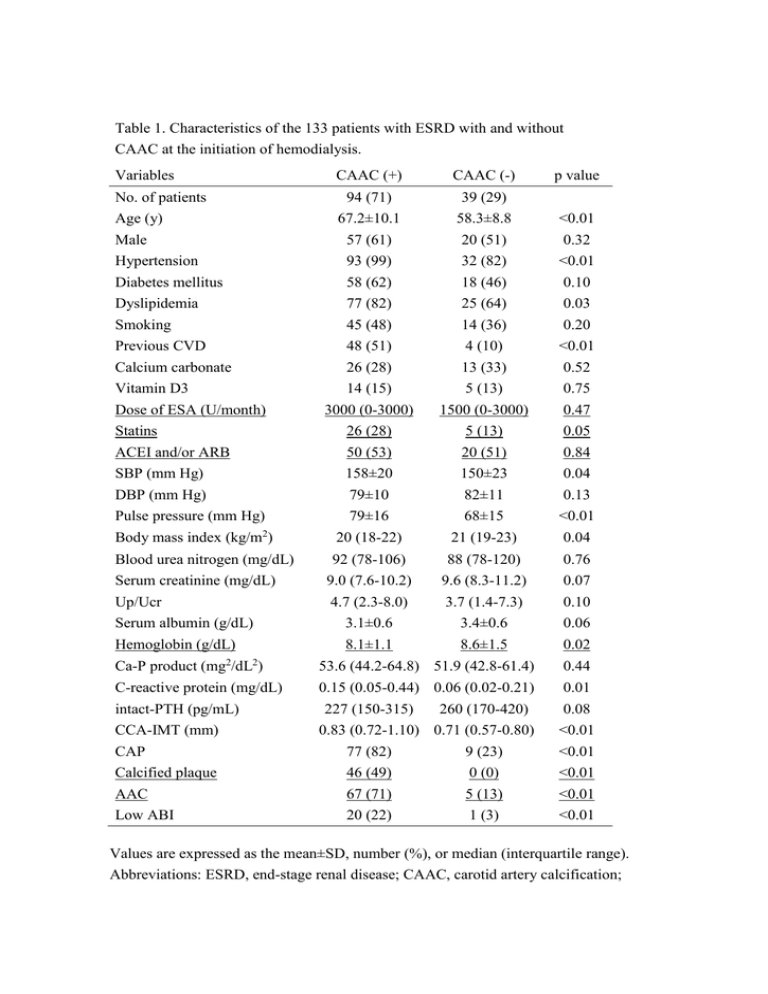
Table 1. Characteristics of the 133 patients with ESRD with and without CAAC at the initiation of hemodialysis. Variables CAAC (+) CAAC (-) p value No. of patients Age (y) Male Hypertension Diabetes mellitus Dyslipidemia 94 (71) 67.2±10.1 57 (61) 93 (99) 58 (62) 77 (82) 39 (29) 58.3±8.8 20 (51) 32 (82) 18 (46) 25 (64) <0.01 0.32 <0.01 0.10 0.03 Smoking Previous CVD Calcium carbonate 45 (48) 48 (51) 26 (28) 14 (36) 4 (10) 13 (33) 0.20 <0.01 0.52 Vitamin D3 Dose of ESA (U/month) Statins ACEI and/or ARB SBP (mm Hg) DBP (mm Hg) Pulse pressure (mm Hg) 14 (15) 3000 (0-3000) 26 (28) 50 (53) 158±20 79±10 79±16 5 (13) 1500 (0-3000) 5 (13) 20 (51) 150±23 82±11 68±15 0.75 0.47 0.05 0.84 0.04 0.13 <0.01 Body mass index (kg/m2) 20 (18-22) 21 (19-23) 0.04 92 (78-106) 9.0 (7.6-10.2) 4.7 (2.3-8.0) 3.1±0.6 8.1±1.1 88 (78-120) 9.6 (8.3-11.2) 3.7 (1.4-7.3) 3.4±0.6 8.6±1.5 0.76 0.07 0.10 0.06 0.02 Blood urea nitrogen (mg/dL) Serum creatinine (mg/dL) Up/Ucr Serum albumin (g/dL) Hemoglobin (g/dL) Ca-P product (mg2/dL2) 53.6 (44.2-64.8) 51.9 (42.8-61.4) 0.44 C-reactive protein (mg/dL) intact-PTH (pg/mL) CCA-IMT (mm) 0.15 (0.05-0.44) 0.06 (0.02-0.21) 227 (150-315) 260 (170-420) 0.83 (0.72-1.10) 0.71 (0.57-0.80) 0.01 0.08 <0.01 CAP Calcified plaque AAC Low ABI 77 (82) 46 (49) 67 (71) 20 (22) 9 (23) 0 (0) 5 (13) 1 (3) <0.01 <0.01 <0.01 <0.01 Values are expressed as the mean±SD, number (%), or median (interquartile range). Abbreviations: ESRD, end-stage renal disease; CAAC, carotid artery calcification; CVD, cardiovascular disease; ESA, erythropoiesis-stimulating agents; ACEI, angiotensin-converting enzyme inhibitors; ARB, angiotensin II receptor blockers; SBP, systolic blood pressure; DBP, diastolic blood pressure; Up/Ucr, urinary protein-creatinine ratio; Ca-P, calcium-phosphorus; PTH, parathyroid hormone; CCA-IMT, common carotid artery-intima-media thickness; CAP carotid artery plaque; AAC, aortic arch calcification; ABI, ankle-brachial index. Table 2. Characteristics at the initiation of hemodialysis of the 133 patients with and without cardiovascular events. Variables CV events (+) CV events (-) p value No. of patients Age (y) Male Hypertension Diabetes mellitus Dyslipidemia 47 (35) 66.7±9.4 29 (62) 46 (98) 30 (64) 38 (81) 86 (65) 63.4±10.9 48 (56) 79 (92) 46 (53) 64 (74) 0.10 0.51 0.13 0.25 0.40 Smoking Previous CV disease Dose of ESA (U/week) Statins ACEI and/or ARB SBP (mm Hg) DBP (mm Hg) Pulse pressure (mm Hg) 26 (55) 21 (45) 9000 (4500-9000) 16 (34) 24 (51) 155±15 78±10 76±12 33 (38) 31 (36) 9000 (9000-9000) 14 (16) 41 (48) 156±23 80±10 75±19 0.06 0.33 0.34 0.02 0.71 0.92 0.34 0.51 Body mass index (kg/m2) 20 (18-23) 21 (19-22) 0.43 Blood urea nitrogen (mg/dL) 92 (73-114) 90 (80-110) 0.60 Serum creatinine (mg/dL) Hemoglobin (g/dL) Up/Ucr Serum albumin (g/dL) 8.4 (6.9-9.7) 8.4±1.1 4.4 (2.0-7.2) 3.1±0.6 9.5 (8.3-10.9) 8.1±1.3 4.6 (1.8-8.1) 3.2±0.6 <0.01 0.22 0.75 0.43 Ca-P product (mg2/dL2) 51.5 (43.7-61.4) 53.3 (43.5-65.0) 0.58 C-reactive protein (mg/dL) intact-PTH (pg/mL) CCA-IMT (mm) CAP Calcified plaque 0.14 (0.05-0.44) 235 (150-302) 0.83 (0.73-0.97) 35 (74) 24 (51) 0.09 (0.04-0.28) 245 (160-381) 0.77 (0.64-0.95) 51 (59) 22 (26) 0.30 0.41 0.09 0.08 <0.01 CAAC AAC Low ABI Duration of follow-up (months) 41 (87) 28 (60) 10 (22) 19.2 (9.1-32.5) 53 (62) 44 (51) 11 (13) 51.6 (38.4-65.7) <0.01 0.35 0.18 <0.01 Values are expressed as the mean±SD, number (%), or median (interquartile range). Abbreviations: CV, cardiovascular; ESA, erythropoiesis-stimulating agents; ACEI, angiotensin-converting enzyme inhibitors; ARB, angiotensin II receptor blockers; SBP, systolic blood pressure; DBP, diastolic blood pressure; Up/Ucr, urinary protein-creatinine ratio; Ca-P, calcium-phosphorus; PTH, parathyroid hormone; CCA-IMT, common carotid artery-intima-media thickness; CAP carotid artery plaque; CAAC, carotid artery calcification; AAC, aortic arch calcification; ABI, ankle-brachial index. Table 3. Risk factors for cardiovascular events by Cox analysis. Multivariatea Univariate Variable HR 95%CI p value HR 95% CI p value Age Male Hypertension Diabetes Mellitus Dyslipidemia Smoking 1.03 1.27 3.27 1.49 1.35 1.95 1.00-1.06 0.71-2.32 0.71-57.9 0.83-2.76 0.68-2.97 1.09-3.52 0.04 0.43 0.15 0.19 0.41 0.02 1.01 1.73 0.98-1.05 0.94-3.20 0.38 0.08 Previous CV disease Pulse pressure (mm Hg) 1.40 1.00 0.78-2.48 0.99-1.02 0.26 0.83 - - - Body mass index (kg/m2) 0.98 0.90-1.07 0.69 - - - Up/Ucr Serum albumin (g/dL) 1.02 0.74 0.97-1.07 0.47-1.17 0.38 0.20 - - - Ca-P product (mg2/dL2) 0.98 0.96-1.00 0.11 - - - C-reactive protein (mg/dL) intact-PTH (pg/mL) CCA-IMT (mm) CAP 1.19 1.00 2.97 1.69 0.66-1.91 0.996-1.00 1.20-6.52 0.90-3.39 0.53 0.14 0.02 0.10 1.51 - 0.52-3.79 - 0.43 - CAAC AAC Low ABI 3.78 1.52 1.77 1.72-9.97 0.85-2.77 0.83-3.43 <0.01 0.15 0.13 2.85 1.18-8.00 0.02 - - - Abbreviations: HR, hazard ratio; CI, confidence interval; CV, cardiovascular; Up/Ucr, urinary protein-creatinine ratio; Ca-P, calcium-phosphorus; PTH, parathyroid hormone; CCA-IMT, common carotid artery-intima-media thickness; CAP, carotid artery plaque; CAAC, carotid artery calcification; AAC, aortic arch calcification; ABI, ankle-brachial index; HR, hazard ratio; CI, confidence interval. a The multivariate model includes variables for which p<0.10 by univariate analysis. Table 4. Characteristics at the initiation of hemodialysis of the 133 patients with and without all-cause death. Variables Death (+) Death (-) p value No. of patients Age (y) Male Hypertension Diabetes mellitus 42 (32) 71.4±8.3 27 (64) 40 (95) 23 (55) 91 (68) 61.4±10.0 50 (55) 85 (93) 53 (58) <0.01 0.31 0.67 0.71 Dyslipidemia Smoking Previous CV disease Dose of ESA (U/week) Satins ACEI and/or ARB SBP (mm Hg) DBP (mm Hg) Pulse pressure (mm Hg) 30 (71) 16 (38) 20 (48) 9000 (6000-9000) 10 (24) 16 (38) 153±15 77±10 77±12 72 (79) 43 (47) 32 (35) 9000 (6000-9000) 20 (22) 49 (54) 156±23 81±10 75±18 0.34 0.32 0.17 0.92 0.81 0.09 0.49 0.03 0.55 Body mass index (kg/m2) 20 (17-23) 21 (19-22) 0.23 89 (73-102) 9.3 (6.9-10.3) 4.3 (1.9-7.9) 3.1±0.5 8.3±1.3 92 (81-114) 9.2 (8.0-10.7) 4.7 (1.9-7.9) 3.3±0.6 8.2±1.3 0.09 0.30 0.66 0.11 0.86 Ca-P product (mg2/dL2) 51.2 (42.1-57.5) 53.7 (44.2-65.3) 0.18 C-reactive protein (mg/dL) intact-PTH (pg/mL) CCA-IMT (mm) CAP 0.18 (0.07-0.51) 235 (168-273) 0.83 (0.74-1.12) 32 (76) 0.07 (0.04-0.25) 250 (148-390) 0.76 (0.64-0.90) 54 (59) 0.04 0.32 <0.01 0.05 Calcified plaque CAAC AAC Low ABI Duration of follow-up (months) 23 (55) 37 (88) 28 (67) 12 (29) 29.1 (17.8-48.5) 23 (25) 57 (63) 44 (48) 9 (10) 53.6 (45.4-67.8) <0.01 <0.01 <0.05 <0.01 <0.01 Blood urea nitrogen (mg/dL) Serum creatinine (mg/dL) Up/Ucr Serum albumin (g/dL) Hemoglobin (g/dL) Values are expressed as the mean±SD, number (%), or median (interquartile range). Abbreviations: CV, cardiovascular; ESA, erythropoiesis-stimulating agents; ACEI, angiotensin-converting enzyme inhibitors; ARB, angiotensin II receptor blockers; SBP, systolic blood pressure; DBP, diastolic blood pressure; Up/Ucr, urinary protein-creatinine ratio; Ca-P, calcium-phosphorus; PTH, parathyroid hormone; CCA-IMT, common carotid artery intima-media thickness; CAP carotid artery plaque; CAAC, carotid artery calcification; AAC, aortic arch calcification; ABI, ankle-brachial index. Table 5. Risk factors for all-cause mortality by Cox analysis. Multivariatea Univariate Variable HR 95%CI p value HR 95% CI p value Age Male Hypertension Diabetes Mellitus Dyslipidemia Smoking 1.08 1.33 1.33 0.92 0.73 0.81 1.05-1.12 0.72-2.56 0.41-8.16 0.50-1.71 0.38-1.49 0.43-1.49 <0.01 0.37 0.68 0.79 0.37 0.50 1.09 - 1.05-1.14 - <0.01 - Previous CV disease Pulse pressure (mm Hg) 1.39 1.00 0.75-2.55 0.99-1.02 0.29 0.65 - - - Body mass index (kg/m2) 0.96 0.87-1.05 0.33 - - - Up/Ucr Serum albumin (g/dL) 1.02 0.62 0.97-1.07 0.38-1.00 0.38 0.05 0.89 0.51-1.58 0.67 Ca-P product (mg2/dL2) 0.98 0.96-1.00 0.11 - - - C-reactive protein (mg/dL) intact-PTH (pg/mL) CCA-IMT (mm) CAP 1.64 1.00 3.76 1.80 0.95-2.58 0.996-1.00 1.58-8.05 0.92-3.86 0.07 0.14 <0.01 0.09 1.68 2.20 0.59 0.91-2.92 0.76-6.00 0.24-1.61 0.10 0.14 0.29 CAAC AAC Low ABI 3.87 1.87 2.70 1.66-11.3 1.00-3.66 1.33-5.15 <0.01 <0.05 <0.01 1.83 0.89 1.83 0.55-6.63 0.43-1.92 0.78-3.94 0.33 0.76 0.16 Abbreviations: HR, hazard ratio; CI, confidence interval; CV, cardiovascular; Up/Ucr, urinary protein-creatinine ratio; Ca-P, calcium-phosphorus; PTH, parathyroid hormone; CCA-IMT, common carotid artery-intima-media thickness; CAP, carotid artery plaque; CAAC, carotid artery calcification; AAC, aortic arch calcification; ABI, ankle-brachial index; HR, hazard ratio; CI, confidence interval. analysis. a The multivariate model includes variables for which p<0.10 by univariate
