Graphing Linear Equations & Inequalities Review Worksheet
advertisement

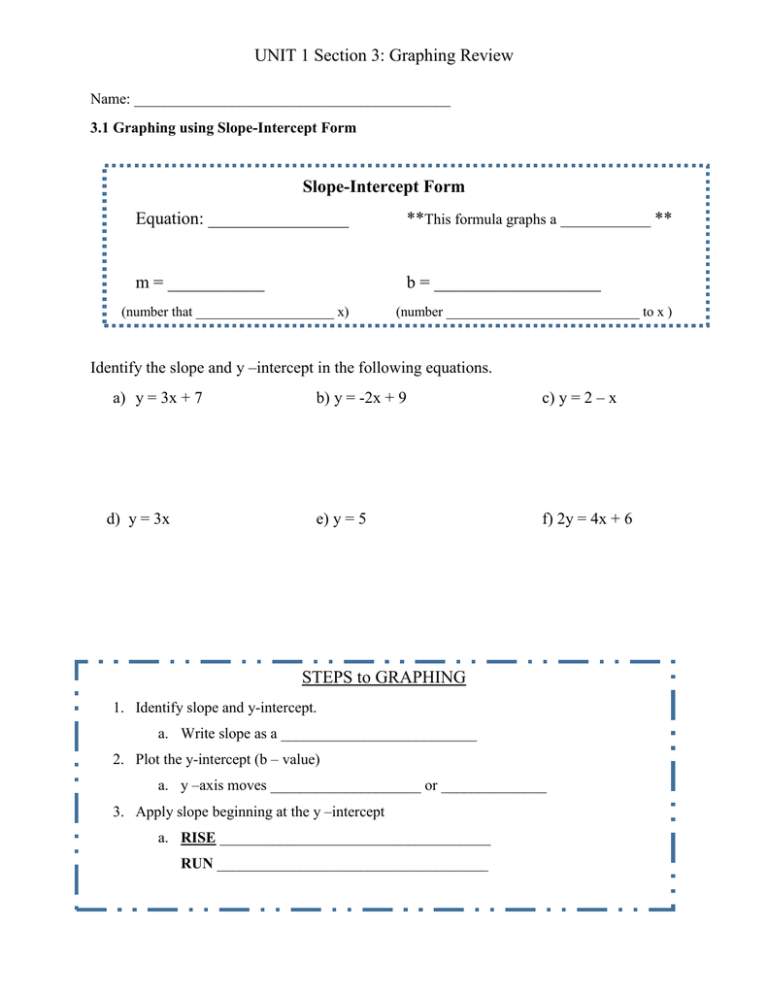
UNIT 1 Section 3: Graphing Review Name: __________________________________________ 3.1 Graphing using Slope-Intercept Form Slope-Intercept Form Equation: ________________ **This formula graphs a ____________ ** m = ___________ b = ___________________ (number that ____________________ x) (number ____________________________ to x ) Identify the slope and y –intercept in the following equations. a) y = 3x + 7 d) y = 3x b) y = -2x + 9 c) y = 2 – x e) y = 5 f) 2y = 4x + 6 STEPS to GRAPHING 1. Identify slope and y-intercept. a. Write slope as a __________________________ 2. Plot the y-intercept (b – value) a. y –axis moves ____________________ or ______________ 3. Apply slope beginning at the y –intercept a. RISE ____________________________________ RUN ____________________________________ UNIT 1 Section 3: Graphing Review UNIT 1 Section 3: Graphing Review Standard Form of a Line: 3.1.1 Put an equation into Slope-Intercept form. An equation is in slope-intercept form when _______________________. Ex 1) 2y = - 4x + 6 Ex 2) - x + 4y = 8 Ex 3) 12 = 2x + 4y Ex 4) 2x – 5y = 20 You Try! 1) 2x – 4y = 8 2) 3y – 9 = 6x UNIT 1 Section 3: Graphing Review 3.2 Graphing Special Lines The equations below have _______________________ variable. y=–1 x= –1 Type: __________________ Type: ____________________ Slope: ________________ Slope: ___________________ UNIT 1 Section 3: Graphing Review 3.3 Graph using x- and y –intercepts. Then find the slope of the line. STANDARD FORM (for the equation of a line) ______________________________________ Ex 2. Find the slope and y-intercept. Graph to find x – and y – intercepts. a. 3x + 4y = 24 b. 2x – 5y = 20 UNIT 1 Section 3: Graphing Review You Try: Graph each line. Find the x – and y –intercept of each linear equations. a. 2x + 3y = 6 c. 8 = 2x – y b. 3x – 5y = 15 d. x = 4y + 12 UNIT 1 Section 3: Graphing Review UNIT 1 Section 3: Graphing Review UNIT 1 Section 3: Graphing Review 3.4 Graphing Linear Inequalities Ex 1) Determine if the following coordinates are solutions to the inequality below 3x + 2y < 6 a. (0, 0) b. (3, 3) c. (-1, 2) d. (2, 0) Graphing Inequalities Procedure 1. Plot line on the graph a. Slope-intercept: Find _____ and _____ b. Standard form: Find _____ and _____ intercepts Points on line…. 2. Type of line a. For ≤ or ≥ use a ___________________ line _____________________ b. For < or < use a ___________________ line _____________________ 3. Shade from solution set. a. Use a test point Ex 2) Graph the inequality y < -2x + 6 UNIT 1 Section 3: Graphing Review Ex 3) Graph the inequality y ≥ −2𝑥 Ex 4) Graph the inequality 3x + 2y < 6


