Weather Unit Plan Lesson 3
advertisement
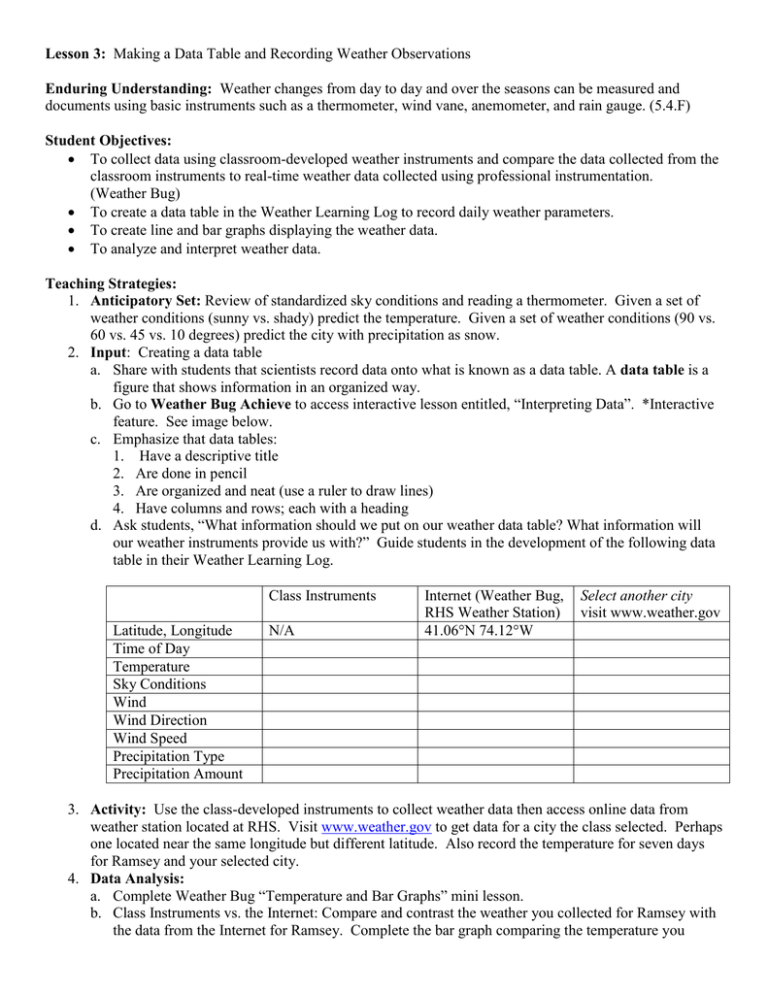
Lesson 3: Making a Data Table and Recording Weather Observations Enduring Understanding: Weather changes from day to day and over the seasons can be measured and documents using basic instruments such as a thermometer, wind vane, anemometer, and rain gauge. (5.4.F) Student Objectives: To collect data using classroom-developed weather instruments and compare the data collected from the classroom instruments to real-time weather data collected using professional instrumentation. (Weather Bug) To create a data table in the Weather Learning Log to record daily weather parameters. To create line and bar graphs displaying the weather data. To analyze and interpret weather data. Teaching Strategies: 1. Anticipatory Set: Review of standardized sky conditions and reading a thermometer. Given a set of weather conditions (sunny vs. shady) predict the temperature. Given a set of weather conditions (90 vs. 60 vs. 45 vs. 10 degrees) predict the city with precipitation as snow. 2. Input: Creating a data table a. Share with students that scientists record data onto what is known as a data table. A data table is a figure that shows information in an organized way. b. Go to Weather Bug Achieve to access interactive lesson entitled, “Interpreting Data”. *Interactive feature. See image below. c. Emphasize that data tables: 1. Have a descriptive title 2. Are done in pencil 3. Are organized and neat (use a ruler to draw lines) 4. Have columns and rows; each with a heading d. Ask students, “What information should we put on our weather data table? What information will our weather instruments provide us with?” Guide students in the development of the following data table in their Weather Learning Log. Class Instruments Latitude, Longitude Time of Day Temperature Sky Conditions Wind Wind Direction Wind Speed Precipitation Type Precipitation Amount N/A Internet (Weather Bug, RHS Weather Station) 41.06°N 74.12°W Select another city visit www.weather.gov 3. Activity: Use the class-developed instruments to collect weather data then access online data from weather station located at RHS. Visit www.weather.gov to get data for a city the class selected. Perhaps one located near the same longitude but different latitude. Also record the temperature for seven days for Ramsey and your selected city. 4. Data Analysis: a. Complete Weather Bug “Temperature and Bar Graphs” mini lesson. b. Class Instruments vs. the Internet: Compare and contrast the weather you collected for Ramsey with the data from the Internet for Ramsey. Complete the bar graph comparing the temperature you collected with the class instruments with the data from the Internet for Ramsey. Then answer the questions that follow. Q1: Is the temperature you recorded using the class instruments the same as that reported on the Internet? If not, can you think of any reasons why they are not the same? Q2: Will the temperature be the same tonight? Tomorrow? In one week? In a month? Why or why not? How would the bar graph change? Q3: Based on the temperature could it have snowed? Explain. Q4: Does your wind data (direction and speed) match the data from the Internet? If not, can you think of any reasons why they are not the same? Q5: Why is it important to use standardized terminology for sky conditions? Are your sky conditions the same as reported on the Internet? If not, can you think of any reasons why they are not the same? c. Ramsey vs. Selected City: Compare and contrast Ramsey with the weather data from your selected city. Complete the bar graph comparing the temperature in your Selected City with Ramsey. Q1: Was the weather similar or different between Ramsey and ________________? Q2: Was the temperature similar or different in both cities? Q3: What reason(s) do you think might account for the similarities or differences? (Hint: there are several) d. Temperature for the last seven days: Analyze the changes in temperature for the last week and compare the two cities. a. Make a line graph comparing the temperature from Ramsey and your selected city for the last seven days vs. time. It is recommended to use two different colors for each city. Q1: For Ramsey, did the temperature go up, down, or stay the same over the past week? Q2: For your selected city, did the temperature go up down, or stay the same over the past week? Q3: How did the two cities compare? Why might the temperature trends be similar or different? e. Assessment: Do you think weather is the same all over the world? Choose a city in another country and write a short narrative about what you think the weather is life there. In your paragraph, try to answer the following: - Do you think the temperature will be warmer or colder than in your own? Why? - How would this affect their lives? For example, their house, clothes, etc - What type of precipitation might you expect? Why? *Adapted from http://www.k12science.org/curriculum/weatherproj2/en/docs/activity2worksheet.shtml Snapshot above from Interpreting Data; below from Temperature and Bar graphs


