Weekly Economic Update
advertisement
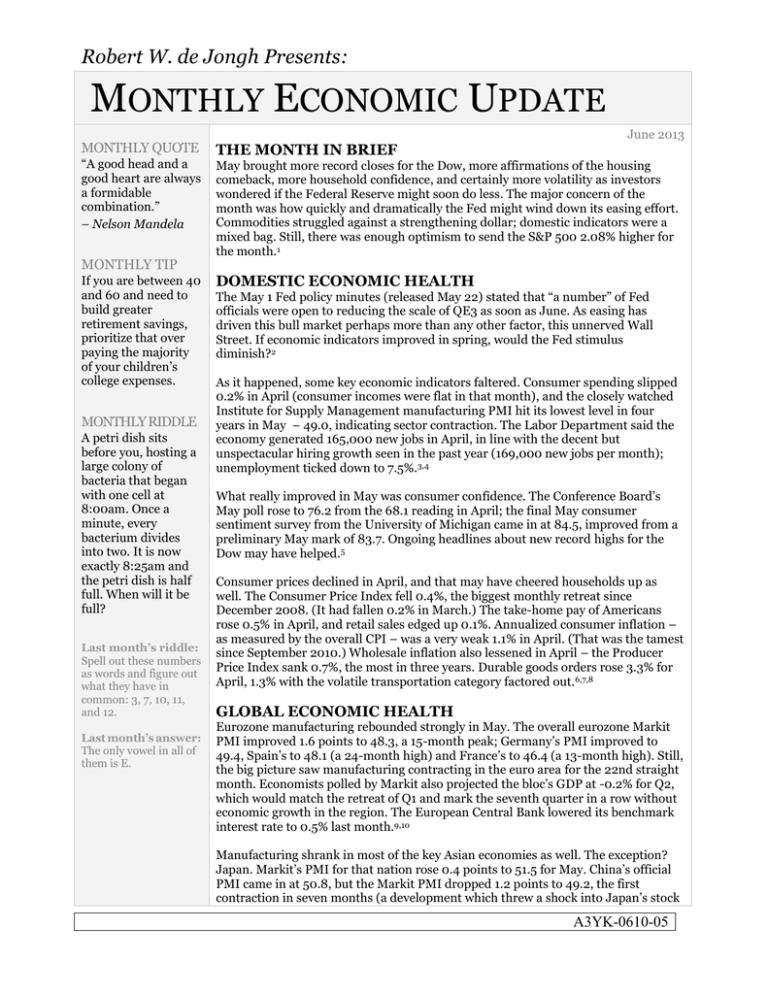
Robert W. de Jongh Presents: MONTHLY ECONOMIC UPDATE MONTHLY QUOTE “A good head and a good heart are always a formidable combination.” – Nelson Mandela MONTHLY TIP If you are between 40 and 60 and need to build greater retirement savings, prioritize that over paying the majority of your children’s college expenses. MONTHLY RIDDLE A petri dish sits before you, hosting a large colony of bacteria that began with one cell at 8:00am. Once a minute, every bacterium divides into two. It is now exactly 8:25am and the petri dish is half full. When will it be full? Last month’s riddle: Spell out these numbers as words and figure out what they have in common: 3, 7, 10, 11, and 12. Last month’s answer: The only vowel in all of them is E. June 2013 THE MONTH IN BRIEF May brought more record closes for the Dow, more affirmations of the housing comeback, more household confidence, and certainly more volatility as investors wondered if the Federal Reserve might soon do less. The major concern of the month was how quickly and dramatically the Fed might wind down its easing effort. Commodities struggled against a strengthening dollar; domestic indicators were a mixed bag. Still, there was enough optimism to send the S&P 500 2.08% higher for the month.1 DOMESTIC ECONOMIC HEALTH The May 1 Fed policy minutes (released May 22) stated that “a number” of Fed officials were open to reducing the scale of QE3 as soon as June. As easing has driven this bull market perhaps more than any other factor, this unnerved Wall Street. If economic indicators improved in spring, would the Fed stimulus diminish?2 As it happened, some key economic indicators faltered. Consumer spending slipped 0.2% in April (consumer incomes were flat in that month), and the closely watched Institute for Supply Management manufacturing PMI hit its lowest level in four years in May – 49.0, indicating sector contraction. The Labor Department said the economy generated 165,000 new jobs in April, in line with the decent but unspectacular hiring growth seen in the past year (169,000 new jobs per month); unemployment ticked down to 7.5%.3,4 What really improved in May was consumer confidence. The Conference Board’s May poll rose to 76.2 from the 68.1 reading in April; the final May consumer sentiment survey from the University of Michigan came in at 84.5, improved from a preliminary May mark of 83.7. Ongoing headlines about new record highs for the Dow may have helped.5 Consumer prices declined in April, and that may have cheered households up as well. The Consumer Price Index fell 0.4%, the biggest monthly retreat since December 2008. (It had fallen 0.2% in March.) The take-home pay of Americans rose 0.5% in April, and retail sales edged up 0.1%. Annualized consumer inflation – as measured by the overall CPI – was a very weak 1.1% in April. (That was the tamest since September 2010.) Wholesale inflation also lessened in April – the Producer Price Index sank 0.7%, the most in three years. Durable goods orders rose 3.3% for April, 1.3% with the volatile transportation category factored out. 6,7,8 GLOBAL ECONOMIC HEALTH Eurozone manufacturing rebounded strongly in May. The overall eurozone Markit PMI improved 1.6 points to 48.3, a 15-month peak; Germany’s PMI improved to 49.4, Spain’s to 48.1 (a 24-month high) and France’s to 46.4 (a 13-month high). Still, the big picture saw manufacturing contracting in the euro area for the 22nd straight month. Economists polled by Markit also projected the bloc’s GDP at -0.2% for Q2, which would match the retreat of Q1 and mark the seventh quarter in a row without economic growth in the region. The European Central Bank lowered its benchmark interest rate to 0.5% last month.9,10 Manufacturing shrank in most of the key Asian economies as well. The exception? Japan. Markit’s PMI for that nation rose 0.4 points to 51.5 for May. China’s official PMI came in at 50.8, but the Markit PMI dropped 1.2 points to 49.2, the first contraction in seven months (a development which threw a shock into Japan’s stock A3YK-0610-05 market and weighed on other exchanges). Taiwan’s PMI descended to 47.1, India’s to 50.1 (poorest since March 2009), South Korea’s to 51.1, Vietnam’s to 48.8 and Indonesia’s to 51.6.11,12 WORLD MARKETS European indices generally moved north in May; benchmarks in the Asia Pacific region (and elsewhere in the Americas) had a tougher time of it. In the plus column: KOSPI, +1.89%; Sensex, +1.31%; Shanghai Composite, +5.63%; TSE 50, +1.18%; TSX Composite, +1.56%; CAC 40, +2.38%; FTSE Eurofirst 300, +1.29%; DAX, +5.50%; FTSE 100, +2.38%. In the minus column: Bovespa, -4.30%; Bolsa, -1.60%; Nikkei 225, -0.62%; Hang Seng, -1.52%; All Ordinaries, -4.93%; Micex, -3.02%; MSCI Emerging Markets, -2.94%; MSCI World, -0.28%.13,14 COMMODITIES MARKETS The U.S. Dollar Index rose 1.63% in May, so it was not exactly a banner month for the broad commodities market. May saw descents for gold (6.06%), silver (8.14%), platinum (2.98%), natural gas (8.33%), oil (1.63%), cocoa (5.64%), wheat (2.46%), corn (3.11%), coffee (5.79%) and sugar (5.32%). Copper did manage an advance of 2.40% in May.15,16 REAL ESTATE As has been the case of late, the best news out of the economy came from this sector. The March edition of the S&P/Case-Shiller Home Price Index showed a 10.9% overall yearly gain, compared with 9.3% in February. New home sales rose 2.3% in April, and existing home sales were up 0.6% in that month, with distressed properties accounting for only 18% of transactions compared to 28% in April 2012. The Census Bureau said that the pace of new home buying had improved 29.0% in a year, and the National Association of Realtors noted an 11.0% yearly increase in the median existing home price to $192,800. NAR had pending home sales improving by 0.3% in April. While housing starts fell 16.5% in April, building permits rose 14.3% (with apartment projects the major influence on both statistics). 3,17,18,19 May brought a significant jump in home loan rates. In Freddie Mac’s May 2 Primary Mortgage Market Survey, the average interest rate on the 30-year FRM was 3.35%; by the May 30 survey, it had hit 3.81%. This mirrored what happened to the 15-year FRM – interest rates on that loan type averaged 2.56% on May 2, 2.98% by May 30. Average interest rates for 5/1-year ARMs rose 0.1% to 2.66% in the same interval while rates on1-year ARMs actually descended a bit, going from 2.56 to 2.54%.20 LOOKING BACK…LOOKING FORWARD The small caps stood tall in May: the Russell 2000 surpassed the 1,000 mark for the first time. It gained 3.87% on the month, ending May at 984.15. As these numbers show, investors didn’t exactly sell and go away last month. Another notable development: the real yield of the 10-year note was nearly back in positive territory at the end of May.1,21 % CHANGE YTD 1-MO CHG 1-YR CHG 10-YR AVG DJIA +15.35 +1.86 +21.96 +7.08 NASDAQ +14.45 +3.82 +22.23 +11.65 S&P 500 +14.34 +2.08 +24.45 +6.92 REAL YIELD 5/31 RATE 1 YR AGO 5 YRS AGO 10 YRS AGO 10 YR TIPS -0.05% -0.50% 1.58% 1.77% 1,21,22 Sources: cnbc.com, bigcharts.com, treasury.gov - 5/31/13 Indices are unmanaged, do not incur fees or expenses, and cannot be invested into directly. These returns do not include dividends. Historically speaking, June has not been a good month for stocks – on average, the A3YK-0610-05 S&P 500 has gone -0.30% in June since 1945. As recently as late May, analysts were wondering if a pullback (or a correction) was in the offing, as even moderately good economic data might encourage Fed officials to taper off easing. How things changed in a week: the subpar ISM manufacturing index reading and retreat in personal spending were bad news, but encouraging developments for a stock market worried that the Fed might perceive the economy as stronger rather than weaker. One of the more ardent Wall Street bulls, S&P’s Sam Stovall, just noted that “the S&P 500’s performance in June could surprise to the upside,” referencing that since 1945, the index has averaged a 0.4% gain in the month following a 7-month winning streak. Even the much-respected “Dr. Doom”, economist Nouriel Roubini, believes Wall Street will see two more years of gains – he said so on CNBC at the start of this month. June may prove a wild card; it may bring more volatility than previous months as investors watch for any little hint of what the Fed might do, how the labor market is faring, how the service and manufacturing sectors are holding up this spring, and how freely consumers are spending and buying. For the record, the next Fed policy meeting wraps up on June 19.23,24 UPCOMING ECONOMIC RELEASES: The data stream for the rest of the month is as follows ... the ISM May non-manufacturing index and a new Fed Beige Book (6/5), the Labor Department’s May jobs report (6/7), April wholesale inventories (6/11), May retail sales ad April business inventories (6/13), May’s PPI and industrial output and the University of Michigan’s initial June consumer sentiment survey (6/14), June’s NAHB housing market index (6/17), May’s CPI and data on May housing starts and building permits (6/18), a Federal Reserve policy announcement (6/19), May existing home sales (6/20), the Conference Board’s June consumer confidence survey, the April Case-Shiller home price index, April’s FHFA housing price index and the numbers on May new home sales and durable goods orders (6/25), the final estimate of Q1 GDP (6/26), the Commerce Department’s May consumer spending report and NAR’s pending home sales report for May (6/27), and then the final University of Michigan consumer sentiment survey for June (6/28). Please feel free to forward this article to family, friends or colleagues. If you would like us to add them to our distribution list, please reply with their address. We will contact them first and request their permission to add them to our list. A3YK-0610-05 «RepresentativeDisclosure» A3YK-0610-05 This material was prepared by MarketingLibrary.Net Inc., and does not necessarily represent the views of the presenting party, nor their affiliates. Marketing Library.Net Inc. is not affiliated with any broker or brokerage firm that may be providing this information to you. This information should not be construed as investment, tax or legal advice and may not be relied on for the purpose of avoiding any Federal tax penalty. This is not a solicitation or recommendation to purchase or sell any investment or insurance product or service, and should not be relied upon as such. The Dow Jones Industrial Average is a price-weighted index of 30 actively traded blue-chip stocks. The NASDAQ Composite Index is an unmanaged, market-weighted index of all over-the-counter common stocks traded on the National Association of Securities Dealers Automated Quotation System. The Standard & Poor's 500 (S&P 500) is an unmanaged group of securities considered to be representative of the stock market in general. It is not possible to invest directly in an index. NYSE Group, Inc. (NYSE:NYX) operates two securities exchanges: the New York Stock Exchange (the “NYSE”) and NYSE Arca (formerly known as the Archipelago Exchange, or ArcaEx®, and the Pacific Exchange). NYSE Group is a leading provider of securities listing, trading and market data products and services. The New York Mercantile Exchange, Inc. (NYMEX) is the world's largest physical commodity futures exchange and the preeminent trading forum for energy and precious metals, with trading conducted through two divisions – the NYMEX Division, home to the energy, platinum, and palladium markets, and the COMEX Division, on which all other metals trade. The Global Dow℠ is a 150-stock index of the most innovative, vibrant and influential corporations from around the world. The KOSPI Index is a capitalization-weighted index of all common shares on the Korean Stock Exchanges. The BSE SENSEX (Bombay Stock Exchange Sensitive Index), also-called the BSE 30 (BOMBAY STOCK EXCHANGE) or simply the SENSEX, is a free-float market capitalizationweighted stock market index of 30 well-established and financially sound companies listed on the Bombay Stock Exchange (BSE). The SSE Composite Index is an index of all stocks (A shares and B shares) that are traded at the Shanghai Stock Exchange. The FTSE TWSE Taiwan 50 Index was launched on October 29, 2002 and covers the top 50 companies in Taiwan by total market capitalization. The S&P/TSX Composite Index is an index of the stock (equity) prices of the largest companies on the Toronto Stock Exchange (TSX) as measured by market capitalization. The CAC-40 Index is a narrow-based, modified capitalization-weighted index of 40 companies listed on the Paris Bourse. The FTSEurofirst 300 Index is part of the FTSEurofirst Index Series and the FTSEurofirst 300 Indices, which are tradable indices measuring the performance of European portfolios. The DAX 30 is a Blue Chip stock market index consisting of the 30 major German companies trading on the Frankfurt Stock Exchange. The FTSE 100 Index is a share index of the 100 companies listed on the London Stock Exchange with the highest market capitalization. The Bovespa Index is a gross total return index weighted by traded volume & is comprised of the most liquid stocks traded on the Sao Paulo Stock Exchange. The Mexican Stock Exchange (Spanish: Bolsa Mexicana de Valores, BMV; BMV: BOLSA) is Mexico's only stock exchange. Nikkei 225 (Ticker: ^N225) is a stock market index for the Tokyo Stock Exchange (TSE). The Nikkei average is the most watched index of Asian stocks. The Hang Seng Index is a freefloat-adjusted market capitalization-weighted stock market index that is the main indicator of the overall market performance in Hong Kong. The AllOrdinaries Index is the most quoted benchmark for Australian equities, comprised of common shares from the Australian Stock Exchange. Moscow Exchange is the largest stock exchange in Russia, located in Moscow, trading equities, bonds, derivatives and currencies. It was officially established on 19 December 2011 through the merger of the two largest Moscow-based stock exchanges, the Moscow Interbank Currency Exchange and the Russian Trading System. The MSCI Emerging Markets Index is a float-adjusted market capitalization index consisting of indices in more than 25 emerging economies. The MSCI World Index is a free-float weighted equity index that includes developed world markets, and does not include emerging markets. The US Dollar Index measures the performance of the U.S. dollar against a basket of six currencies. Additional risks are associated with international investing, such as currency fluctuations, political and economic instability and differences in accounting standards. This material represents an assessment of the market environment at a specific point in time and is not intended to be a forecast of future events, or a guarantee of future results. Past performance is no guarantee of future results. Investments will fluctuate and when redeemed may be worth more or less than when originally invested. All information is believed to be from reliable sources; however we make no representation as to its completeness or accuracy. All economic and performance data is historical and not indicative of future results. Market indices discussed are unmanaged. Investors cannot invest in unmanaged indices. The publisher is not engaged in rendering legal, accounting or other professional services. If assistance is needed, the reader is advised to engage the services of a competent professional. Citations. 1 - cnbc.com/id/100779852 [5/31/13] 2 - reuters.com/article/2013/05/22/markets-usa-stocks-idUSL2N0E321R20130522 [5/22/13] 3 - marketwatch.com/Economy-Politics/Calendars/Economic [6/3/13] 4 - ncsl.org/issues-research/labor/national-employment-monthly-update.aspx [5/3/13] 5 - briefing.com/investor/calendars/economic/2013/05/27-31 [5/31/13] 6 - businessweek.com/news/2013-05-16/consumer-prices-in-u-dot-s-dot-dropped-more-than-forecast-in-april [5/16/13] 7 - usatoday.com/story/money/business/2013/05/13/april-retail-sales/2154725/ [5/13/13] 8 - thestreet.com/story/11933260/1/sp-poised-for-three-day-losing-streak-amid-qe-wind-down-chatter.html [5/24/13] 9 - bbc.co.uk/news/business-22752897 [6/3/13] 10 - markit.com/assets/en/docs/commentary/markit-economics/2013/jun/EZ_Manufacturing_ENG_1306_PR.pdf [6/3/13] 11 - markit.com/assets/en/docs/commentary/markit-economics/2013/jun/Asia_trade_13_06_3.pdf [6/3/13] 12 - reuters.com/article/2013/06/01/us-china-economy-pmi-idUSBRE95001W20130601 [6/1/13] 13 - markets.on.nytimes.com/research/markets/worldmarkets/worldmarkets.asp [5/31/13] 14 - mscibarra.com/products/indices/international_equity_indices/gimi/stdindex/performance.html [5/31/13] 15 - online.wsj.com/mdc/public/npage/2_3050.html?mod=mdc_curr_dtabnk&symb=DXY [5/1/13] 16 - money.cnn.com/data/commodities/ [5/31/13] 17 - csmonitor.com/Business/new-economy/2013/0523/New-home-sales-rise-but-market-still-a-long-way-from-normal [5/23/13] 18 - realtor.org/news-releases/2013/05/april-existing-home-sales-up-but-constrained [5/22/13] 19 - latimes.com/business/money/la-fi-mo-housing-starts-construction-building-permits-economy-20130516,0,7678305.story [5/16/13] 20 - freddiemac.com/pmms/ [5/30/13] 21 - bigcharts.marketwatch.com/historical/default.asp?symb=DJIA&closeDate=5%2F31%2F12&x=0&y=0 [5/31/13] 21 - bigcharts.marketwatch.com/historical/default.asp?symb=COMP&closeDate=5%2F31%2F12&x=0&y=0 [5/31/13] 21 - bigcharts.marketwatch.com/historical/default.asp?symb=SPX&closeDate=5%2F31%2F12&x=0&y=0 [5/31/13] 21 - bigcharts.marketwatch.com/historical/default.asp?symb=DJIA&closeDate=5%2F30%2F03&x=0&y=0 [5/31/13] 21 - bigcharts.marketwatch.com/historical/default.asp?symb=COMP&closeDate=5%2F30%2F03&x=0&y=0 [5/31/13] A3YK-0610-05 21 - bigcharts.marketwatch.com/historical/default.asp?symb=SPX&closeDate=5%2F30%2F03&x=0&y=0 [5/31/13] 22 - treasury.gov/resource-center/data-chart-center/interest-rates/Pages/TextView.aspx?data=realyieldAll [6/3/13] 23 - businessweek.com/printer/articles/520656?type=bloomberg [6/3/13] 24 - cnbc.com/id/100785848 [6/3/13] A3YK-0610-05
