Supplementary Information Appendix C: Supplementary tables
advertisement
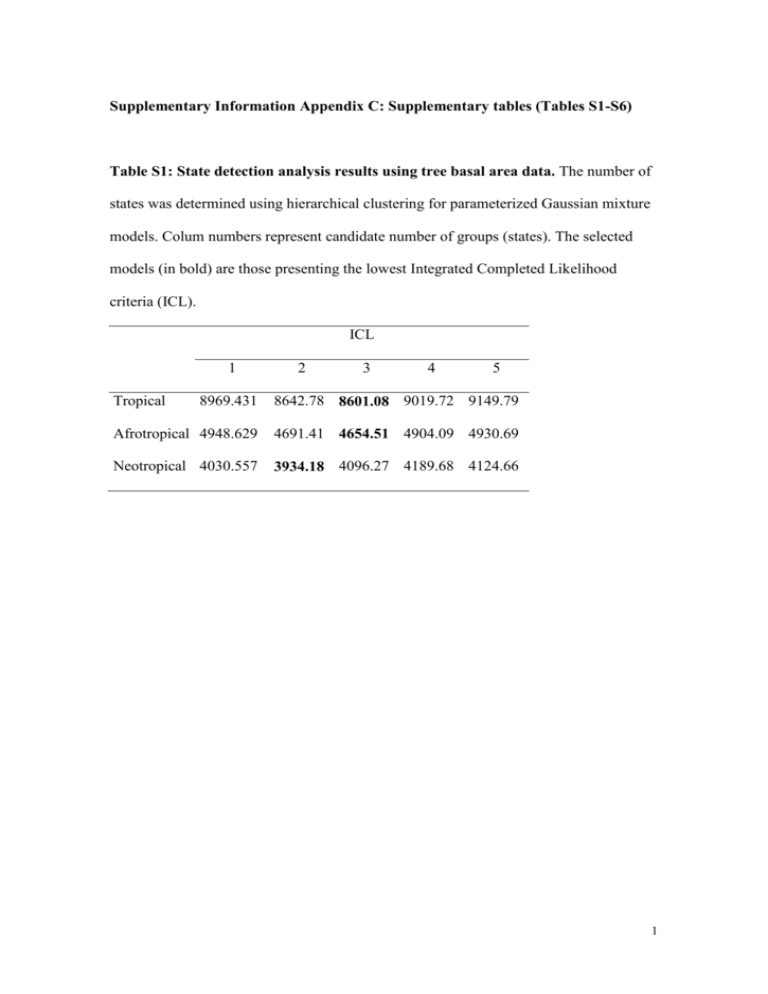
Supplementary Information Appendix C: Supplementary tables (Tables S1-S6) Table S1: State detection analysis results using tree basal area data. The number of states was determined using hierarchical clustering for parameterized Gaussian mixture models. Colum numbers represent candidate number of groups (states). The selected models (in bold) are those presenting the lowest Integrated Completed Likelihood criteria (ICL). ICL 1 Tropical 2 3 4 5 8969.431 8642.78 8601.08 9019.72 9149.79 Afrotropical 4948.629 4691.41 4654.51 4904.09 4930.69 Neotropical 4030.557 3934.18 4096.27 4189.68 4124.66 1 Table S2: Results of the likelihood-ratio test for bimodality between adjacent detected modes (see Fig. 1A-C and Table S1) in Afrotropical and the Neotropical communities. WG: wooded grasslands; S: savannas; F: forests. Tropical LR WG-S S-F Afrotropical P* LR P* Neotropical LR P* - - 56.49 <0.001 63.62 <0.001 472.71 <0.001 170.57 <0.001 177.31 <0.001 *P ≤ 0.05 indicate a significant bimodality. 2 Table S3: Model comparison between continuous models (i.e. linearized multiple regression) and split models (i.e. ANCOVA) of tree basal area against the Resource Availability Index. The Resource Availability Indices (RAI) are described in details in Table S4 for each continent. λ and Xtrans refer to the transformation selected to TBA and the RAI axes, respectively, in order to linearize the associations (see methods). The same transformations used in the continuous models are used in the split models. The P values in the last column refer to ANOVA results for continuous vs. split model comparison. ALL: tropical; AFR: Afrotropical; NEO: Neotropical. Continuous model λ P BIC Split model AICc R2adj P BIC L vs. S model AICc ∆BIC ∆AICc Xtrans R2adj ALL 0.48 none 0.52 <0.001 3429.20 3404.15 0.88 <0.001 1936.04 1871.10 1493.16 1533.06 <0.001 AFR 0.58 none 0.76 <0.001 2062.39 2040.38 0.92 <0.001 1399.47 1342.59 662.92 697.78 <0.001 NEO 0.44 Recip 0.28 <0.001 1492.94 1471.93 0.78 <0.001 907.07 585.86 602.52 <0.001 869.42 P 3 Table S4: Results of the principal component analyses used to derive the three axes of the Resource Availability Indices. The variables included in the PCAs of each biogeographic context (tropical, Afrotropical and Neotropical) are those of the multiple regression model (with tree basal area as response) presenting the lowest Akaike Information Criteria (∆AIC of 5.21, 2.85 and 3.56, respectively). TRO: tropical (both Neotropical and Afrotropical) communities; AFR: Afrotropical communities; NEO: Neotropical communities. PE: proportion explained; PC: significant positive correlates; NC: significant negative correlates. map: mean annual precipitation; msi: Markham Seasonality Index; cec: soil cation exchange capacity; soc: soil organic carbon; maxt: maximum annual temperature; mint: minimal annual precipitation. PC1 PC2 PC3 TRO PE 0.68129 0.18512 0.07695 PC map, soc cec, pH - map, msi map, msi, cec, soc, pH 0.21127 0.07673 Cec map, msi, soc NC msi, cec, pH AFR PE 0.6258 PC map, soc, mint NC msi, cec, maxt msi, mint, maxt NEO PE 0.5202 0.25635 PC map, soc, mint cec, pH, mint NC msi, pH Map cec, mint, maxt 0.12905 map, cec, soc msi, mint 4 Table S5: Wilcoxon rank sum test results comparing fire regimes between biome states within shared fractions of the resource space. The shared fractions were defined as those in which the Resource Availability Index hypervolume of two biome states overlap (see Fig. 2 and Table 2). NF: Number of active Fire records (2002-13); FI: Fire Intensity (MW); WG: wooded grasslands; S: savannas; F: forests. Fire Afrotropical WG vs. S WG vs. F W W P P Neotropical S vs. F W P S vs. F W P NF 5934 <0.001 644 0.002 20906 <0.001 27243 <0.001 FI 10648 0.074 1327 0.156 20173 <0.001 26457 <0.001 5 Table S6: ANOVA results comparing environment and disturbance predictors among all biome states. Different letter indicate significant differences in Tukey’s pairwise comparisons. AWG: Afrotropical wooded grasslands; AS: Afrotropical savannas; AF: Afrotropical forests; NS: Neotropical savannas; NF: neotropical forests. MAP: Mean Annual Precipitation; MSI: Markham Seasonality Index; MinT: minimal annual temperature; MaxT: maximal annual temperature; NF: Number of active Fire records (2002-13); FI: fire intensity; SOC: soil organic carbon; CEC: cation exchange capacity; and Sand: soil sand percentage. Vegetation State AWG MAP (mm) AS AF ANOVA NS NF 549.02±218.37a 853.38±297.97b 1737.97±423.36c 1352.47±276.6d 1821.5±664.97c F P 461.0 <0.001 MSI 0.65±0.12a 0.60±0.13a 0.32±0.14b 0.53±0.09c 0.44±0.13d 221.4 <0.001 MinT (oC) 10.62±4.01a 10.73±4.73a 18.08±2.93b 14.99±4.07c 15.92±4.43c 119.7 <0.001 MaxT (oC) 34.89±4.88a 33.21±3.42b 31.46±1.68c 31.10±2.14c 31.06±2.30c 52.5 <0.001 NF (fires y-1) 3.95±4.82a 7.58±6.70b 1.37±3.39c 4.23±3.46b 2.69±3.41a 96.3 <0.001 45.18±39.95a 36.30±26.19a 11.59±+16.00b 47.03±73.76c 30.04±24.11a 99.7 <0.001 SOC (g kg-1) 9.15±3.33a 10.06±3.27a 18.78±7.62b 12.06±3.64c 17.00±7.66d 167.6 <0.001 CEC (cmol kg-1) 13.28±6.14a 12.22±8.52b 9.98±2.98c 10.73±5.00bc 11.56±5.79bc FI (MW) 8.4 <0.001 pH Sand (%) 4.88±0.36a 4.45±0.66b 3.38±0.44c 4.04±0.43d 3.58±0.67e 235.1 <0.001 73.89±18.79a 74.69±16.19a 62.21±11.21b 62.96±9.52b 58.24±8.63c 59.3 <0.001 7

