Chungwook Sim
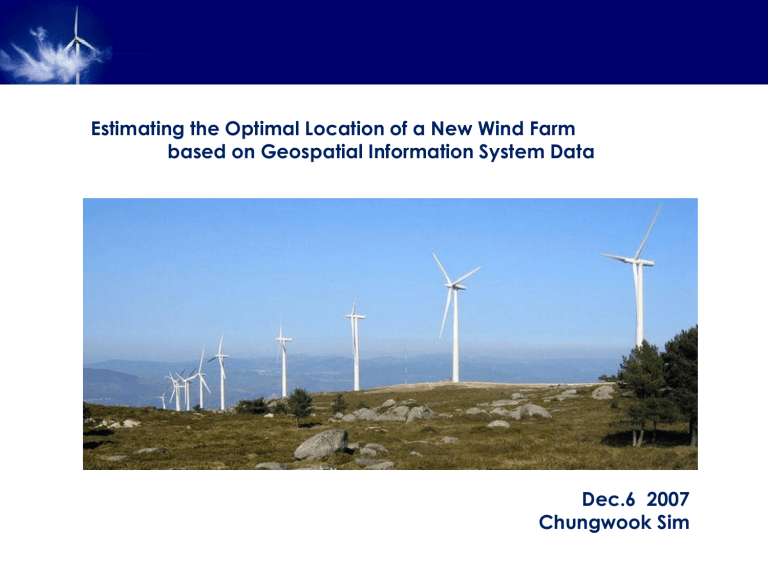
Estimating the Optimal Location of a New Wind Farm based on Geospatial Information System Data
Dec.6 2007
Chungwook Sim
How does a Wind Turbine Works?
Generating the Power
- Inside the wind turbine
(retrieved from http://green.nationalgeographic.com)
- Blades
- Low-speed shaft, Gear box, High-speed shaft
- Generator
- Numerical Weather Prediction model
“meso-scale”, “micro-scale”
- Wind Shear Profile
“atmospheric stability”, “roughness”
- Wind Speed at Hub height
- Annual Power prediction
General Sketch of the Project
- Understand the stability influential factors of a wind shear profile
“Richardson Number”,
“Monin-Obukhov Length”
- Use GIS to integrate various layers
“Multi-dimensional tools”,
“Spatial-analyst tools”
Objective of the Project
Physical Concepts of Boundary-Layer Flow
- Navier-Stokes and Continuity Equation of the atmosphere
t
u
u
u
p
2
(
u
)
2 f g
- Reynolds-
Averaged
Equations and the
Turbulent Momentum Flux
t
U
U
U
p
2
(
U
)
2
U
f g
t
- Wind Speed u i
( t )
U i
( t )
u i
( t ) U i
( t )
u i
( t ) u i
( t )
1
T
t t
T u i
( t
) d t
O
Logarithmic Wind Shear Profile
- Mixing Length, Friction velocity, roughness length
t
U
U
U
p
2
(
U
)
2
U
f g
t
t , ij
u
i u j
t , ij
l
2
z
U
2 u
U ( z
l )
U ( z )
l
z
U ( z )
z
U
t , xz
1
z
u
*
z
t , ij
(
z )
2
z
U
2
U ( z )
u
*
ln
z z
0
Thermal Stratification on the Wind Shear Profile
Richardson Number and Monin-Obukhov Length
m
z
H ,
u u
*
z
, z
m
, m u
*
, z z
L
m z
L
( z )
ln
T ( z
2
) x
ln
( z )
2 x
2
Richardson Number
L
5
L
L Ri
(
z )
u
*
3
x
c u
*
A p gH
ln
16
z z
L z
0
1 /
u c
4 gH
*
2 p
z
U m
2 tan
1
( x )
z
L
gH
2 u
*
3 c p
z
m
( H , u
*
, z )
Data Collection
Format of the data (NetCDF)
Data Catalog of National Centers for Enviornmental Prediction (NCEP) a) Choose various locations with different terrain conditions in Texas.
>> http://ned.usgs.gov//
>> http://www.geographynetwork.com/ that can affect the wind power production.
- Resolution:
32 km grid
c) Collect climate data of wind speed from NOAA online.
>> http://cdo.ncdc.noaa.gov/CDO/cdo
- Data available:
1979 to current
the energy demand of each location.
>> http://landcover.usgs.gov/classes.php
Data Verification- Comparison with TCOON Measurements
NARR v.s. TCOON Measurements
16m
16m
16c
507m
507c
Spreadsheet of Wind Shear Profile Correction
100
Spreadsheet of Wind Shear Profile Correction
Wind Shear Profile Correction (Eagle Point Station 507_Sep.2 ,2007)
Height (m)
Log-scale
10
0:00
3:00
6:00
9:00
12:00
15:00
18:00
21:00
1
0 1 2 3 4
Wind Speed (m/s)
5
Wind Power of US
Conditions at the Great Plain- Richardson Number
Conclusions and Future Work
- GIS is useful in integrating a great number of variables
“Map Algebra” with scripts!
- NARR data catalog is useful in estimating climate related topics
“verification required near surface”
- Annual Power prediction v.s. Demand of Power?
“accuracy in wind speed at hub-height”


