Island_Biogeography_Lab
advertisement
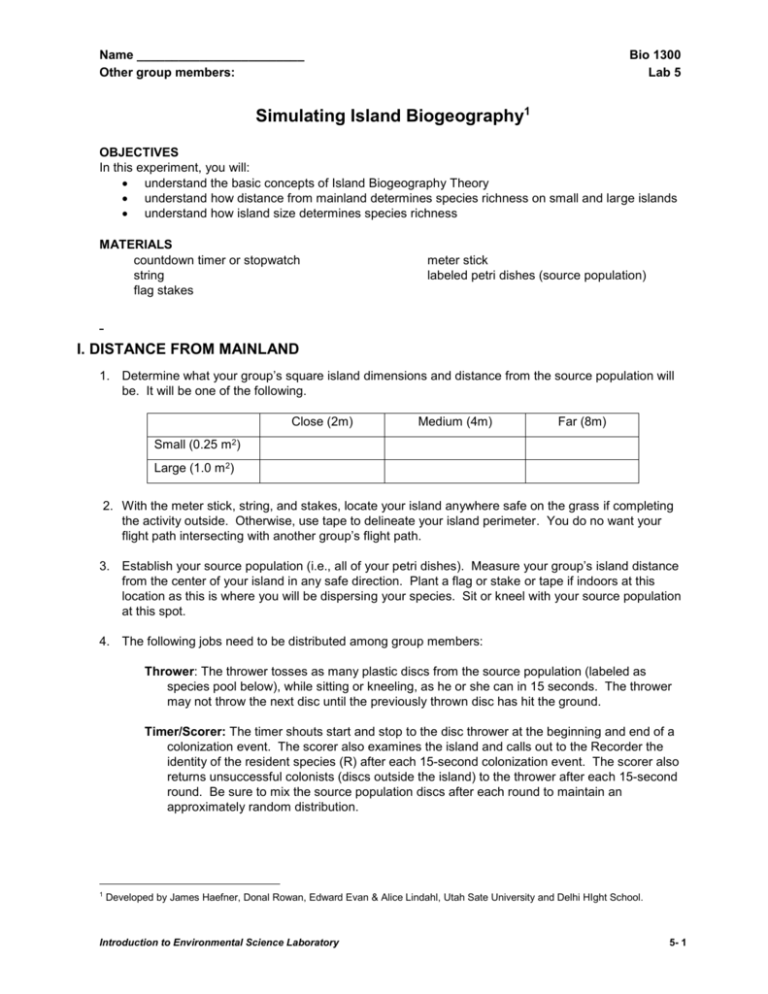
Name ________________________ Other group members: Bio 1300 Lab 5 Simulating Island Biogeography1 OBJECTIVES In this experiment, you will: understand the basic concepts of Island Biogeography Theory understand how distance from mainland determines species richness on small and large islands understand how island size determines species richness MATERIALS countdown timer or stopwatch string flag stakes meter stick labeled petri dishes (source population) I. DISTANCE FROM MAINLAND 1. Determine what your group’s square island dimensions and distance from the source population will be. It will be one of the following. Close (2m) Medium (4m) Far (8m) Small (0.25 m2) Large (1.0 m2) 2. With the meter stick, string, and stakes, locate your island anywhere safe on the grass if completing the activity outside. Otherwise, use tape to delineate your island perimeter. You do no want your flight path intersecting with another group’s flight path. 3. Establish your source population (i.e., all of your petri dishes). Measure your group’s island distance from the center of your island in any safe direction. Plant a flag or stake or tape if indoors at this location as this is where you will be dispersing your species. Sit or kneel with your source population at this spot. 4. The following jobs need to be distributed among group members: Thrower: The thrower tosses as many plastic discs from the source population (labeled as species pool below), while sitting or kneeling, as he or she can in 15 seconds. The thrower may not throw the next disc until the previously thrown disc has hit the ground. Timer/Scorer: The timer shouts start and stop to the disc thrower at the beginning and end of a colonization event. The scorer also examines the island and calls out to the Recorder the identity of the resident species (R) after each 15-second colonization event. The scorer also returns unsuccessful colonists (discs outside the island) to the thrower after each 15-second round. Be sure to mix the source population discs after each round to maintain an approximately random distribution. 1 Developed by James Haefner, Donal Rowan, Edward Evan & Alice Lindahl, Utah Sate University and Delhi HIght School. Introduction to Environmental Science Laboratory 5- 1 Exercise 5 Recorder: The person records on the data sheets the species present after a throwing bout as determined by the scorer. Furthermore, he or she keeps track of immigration (I) and extinction (E) events. All information is tallied on the data sheets. 5. After a colonization bout, the number immigrants and extinctions are tallied. To do this, immigrants, extinctions and individual deaths must be determined. Immigrant (I): An immigration event is the arrival on the island of an individual (disc) which was not present in the prior colonization bout. At least one-half of the disc must be inside the boundary to count as a successful individual. Extinctions (E) and Individuals Deaths: An individual dies and is removed from the island if another individual lands on top of it. A species goes extinct when the last individual in its species is removed from the island. If this happens, there will be no “X” in its column on the data sheet and it will be recorded as an extinction event. Remove the dead individual by sliding it from the under the new species and return it to the source population. If a newly immigrating individual lands on one of the two or more individuals on the island, both are killed and removed from the island. All discs coming to rest outside the island boundaries or more than halfway outside the island boundaries following a 15-second colonization attempt are considered “dead” and recycled. Number of Resident Species: The number of resident species (R) is the number of each species remaining on the island after a 15-second colonization event after taking into consideration any extinctions or new immigrations that took place. Note: Consult with your instructor if you have any questions about scoring. It is important that all groups are consistent. Tips for accuracy: 5-2 Take care throwing. Throw as accurately but as quickly as you can in each 15-second bout. After each bout, return all of the discs that are outside the island back to the Thrower. Do not remove the discs from within the island. Randomize your source pool of species. Before each throwing bout, mix up the species pool of disks. Introduction to Environmental Science Laboratory Island Biogeography 6. Tally data on the data sheet included in this lab. Species are listed across the top, and time (colonizing bout) along the side. Remember: only presence or absence of species is important; we do not need to record numbers of individuals. Review the worked example below before beginning. Table 2: Sample calculations of R, I, and E Bout A 0 -- SPECIES B C -- 1 -- D VARIABLES R I E -- 0 1 0 1 2 0 3 1 1 3 -- -- X 2 X X 3 X X X X From bout = 0 to bout = 1, your island had 1 immigrant (species B) and, of course, no extinctions. So, a 1 is recorded in the I column at bout = 0, and the immigrating species B is checked (X) in the bout = 1 row. Therefore, the number of residents after the first colonization bout is 1 (1 = 0 + 1 – 0). From bout = 1 to bout = 2, your island had 2 immigrants (species A and C) and no extinctions. So, a 2 is recorded in the I column at bout = 1 and a 0 in the E column at bout = 1. The species immigrating are checked in the bout = 2 row by placing an 'X' in the columns A and C. Therefore, the number of residents after the second bout is 3 (3 = 1 + 2 - 0). From bout = 2 to bout = 3, your island had 1 immigrant (species D) and 1 extinction (species C). So, a 1 is recorded in the I and E columns at bout = 2, and the species are checked in the bout = 3 row. Therefore, the number of residents after 3 bouts is 3 (3 = 3 + 1 – 1). This process is continued until 20, 15-second colonization bouts have been completed. 7. When all the groups have completed 20 bouts (or told to stop by the instructor), write your data on I, E and R on the board and record the class data in the sheet below. Close (2m) R I Medium (4m) E R I Far (8m) E R I E Small (0.25 m2) Large (1.0 m2) Introduction to Environmental Science Laboratory 5-3 Exercise 5 8. Variables are factors which control variation in an experiment, and generally two types are recognized. Independent variable is the one governing the change in the second variable (the dependent variable). Analyze this data by constructing graphs. To determine which graphs are the most appropriate, you must return to your initial question(s). In this case we asked: How does distance from mainland (the independent variable) affect R, I, and E on small and large islands (dependent variables)? How would you graph this data to address this question? (Hint: you might need more than one graph; place the independent variable on the X axis). II. ISLAND SIZE Each group will be assigned on the following island sizes as shown below. Repeat the experiment above with your island but at 4m from island to source population. You do not need to record numerically immigrations and extinctions. Here, we are interested only in the equilibrium number of species. So, after each colonizing bout, kill the individuals that overlap, return the outside plates to the thrower, and record the number of species on the island. Repeat until the numbers of species is approximately constant over three bouts. Share your results with the class and record all of the class data on the chart below. Island area (m2) Number of species 0.09 0.25 0.49 0.81 1.0 2.25 Analyze this data also by constructing a graph. III. WRITEUP: Answer the questions concerning Island Biogeography by using and including your graphs. Remember to include all of the necessary elements in your graphs (title, axis labels, linear regression with correlation value to assess data fitting line, etc. One report per group is sufficient. 5-4 Introduction to Environmental Science Laboratory Island Biogeography Introduction to Environmental Science Laboratory 5-5
