Document
advertisement
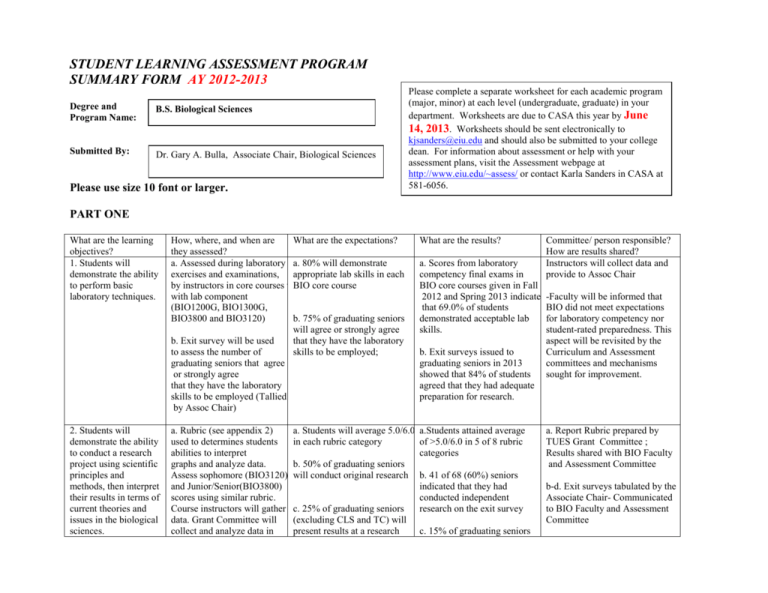
STUDENT LEARNING ASSESSMENT PROGRAM SUMMARY FORM AY 2012-2013 Degree and Program Name: B.S. Biological Sciences Submitted By: Dr. Gary A. Bulla, Associate Chair, Biological Sciences Please use size 10 font or larger. Please complete a separate worksheet for each academic program (major, minor) at each level (undergraduate, graduate) in your department. Worksheets are due to CASA this year by June 14, 2013. Worksheets should be sent electronically to kjsanders@eiu.edu and should also be submitted to your college dean. For information about assessment or help with your assessment plans, visit the Assessment webpage at http://www.eiu.edu/~assess/ or contact Karla Sanders in CASA at 581-6056. PART ONE What are the learning objectives? 1. Students will demonstrate the ability to perform basic laboratory techniques. 2. Students will demonstrate the ability to conduct a research project using scientific principles and methods, then interpret their results in terms of current theories and issues in the biological sciences. How, where, and when are What are the expectations? they assessed? a. Assessed during laboratory a. 80% will demonstrate exercises and examinations, appropriate lab skills in each by instructors in core courses which BIO core has acourse with lab component (BIO1200G, BIO1300G, BIO3800 and BIO3120) b. 75% of graduating seniors will agree or strongly agree b. Exit survey will be used that they have the laboratory to assess the number of skills to be employed; graduating seniors that agree or strongly agree that they have the laboratory skills to be employed (Tallied by Assoc Chair) a. Rubric (see appendix 2) used to determines students abilities to interpret graphs and analyze data. Assess sophomore (BIO3120) and Junior/Senior(BIO3800) scores using similar rubric. Course instructors will gather data. Grant Committee will collect and analyze data in What are the results? a. Scores from laboratory competency final exams in BIO core courses given in Fall 2012 and Spring 2013 indicate that 69.0% of students demonstrated acceptable lab skills. b. Exit surveys issued to graduating seniors in 2013 showed that 84% of students agreed that they had adequate preparation for research. a. Students will average 5.0/6.0 a.Students attained average in each rubric category of >5.0/6.0 in 5 of 8 rubric categories b. 50% of graduating seniors will conduct original research b. 41 of 68 (60%) seniors indicated that they had conducted independent c. 25% of graduating seniors research on the exit survey (excluding CLS and TC) will present results at a research c. 15% of graduating seniors Committee/ person responsible? How are results shared? Instructors will collect data and provide to Assoc Chair -Faculty will be informed that BIO did not meet expectations for laboratory competency nor student-rated preparedness. This aspect will be revisited by the Curriculum and Assessment committees and mechanisms sought for improvement. a. Report Rubric prepared by TUES Grant Committee ; Results shared with BIO Faculty and Assessment Committee b-d. Exit surveys tabulated by the Associate Chair- Communicated to BIO Faculty and Assessment Committee preparation for National Science Foundation teaching Grant (TUES grant). b. Number of graduating seniors (excluding CLS and TC) that have been engaged in undergraduate research projects (Tallied by Assoc Chair) conference. d. Total number of 80 student semesters engaged in undergrad research will be met presented results at a research conference. d. Total number of student semesters engaged in undergraduate research was 94 for FY13 c. Number of graduating seniors excluding CLS and TC) presenting at research conferences (Tallied by Assoc Chair) d. Number of total Bio students engaged in undergraduate research projects (Tallied by Assoc Chair) 3. Students will demonstrate an ability to write effectively. EWP data will be utilized EWP submissions will average 3.5 or above in critical writing samples in BIO courses 4. Students will be able to construct a professional research poster Bio3120 ( a core BIO course) Students will average 3.0/4.0 students will produce in each rubric category professional posters; A rubric (see Appendix 3) will be used to assess poster quality . Not yet instituted 5. Student will enhance global citizenship by participation in biology clubs with conservation and/or volunteer efforts. Assessed by Biology exit Surveys administered electronically at end of fall and Spring semesters by Assoc Chair 53% of graduating seniors Data will be shared with faculty; indicated that they participated Faculty requested to promote club in one or more of these clubs Activity 50% of graduating seniors will indicate that they have participated in biology clubs (Botany, Wildlife, Pre-med, Pre-vet, Eathwise) -EWP papers submitted for Bio Benchmark not met. Discuss in core courses received average faculty meeting how to improve ratings of 3.37/4.0 (3.36 COS lab report submissions. Ave) ; Data will be evaluated by TUES Committee and presented to faculty 6. Students will demonstrate the quantitative and analytical skills to analyze data sets generated by biological experiments and surveys. a. Bio3120 (Molec. Cell Biology) lab grades and rubric , exams and research projects; capstone course (BIO 4984), Assessed by instrictors. 7. Students will demonstrate the ability to critically read and evaluate research papers and review articles in the biological sciences. Research report written for inclusion in writing portfolio; term paper written for senior capstone course (BIO 4984) a. 80% will demonstrate proficiency by attaining grades of C or higher on laboratory finals. a. 69% of students earned grades of C or higher on laboratory finals in the BIO core courses. b. Watson-Glaser scores exceed the COS mean. b. Watson-Glaser were slightly above previous years, increasing from 26.6 to 27.9 substantially above the EIU mean of 25.2. -80% will demonstrate proficiency by attaining grades of C or higher on research report and term paper. . 38 of 47 (81%) of students earned grades of C or higher on BIO 4984 capstone term paper. b. Watson-Glaser Tests (EIU Testing Center) . Benchmaks for lab final in core courses not met. Data shared with faculty and Assessment Committee Results shared with Faculty and Assessment Committee. (Continue objectives as needed. Cells will expand to accommodate your text.) PART TWO Describe your program’s assessment accomplishments since your last report was submitted. Discuss ways in which you have responded to the CASA Director’s comments on last year’s report or simply describe what assessment work was initiated, continued, or completed. In response to the CASA Directors comments for FY12, we have removed the MFT as an assessment tool, included three of the Provosts learning goals into the assessment, moved the EWP results to a new category related to student writing, and the feedback loop more clearly explained, indicating that entire faculty discussion will take place at the faculty retreat and during regular faculty meetings to engage faculty in assessment . I. Content learning assessment The MFP test in Biology was critically analyzed by the BIO Assessment Committee and deemed an inadequate assessment tool due to lack of participation by the majority of sister institutions. Faculty discussions took place to identify another mechanisms assess student knowledge. An in-house exam is being developed to assess learning of content. Integrative learning- A group of BIO faculty was awarded a $7K Proposal Initiative Fund (PIF) grant from the Office of Grants and Sponsored Research to acquire preliminary data for submission of a large grant proposal to the National Science Foundation (NSF) designed to broadly improve the BIO curriculum. The PIF project , entitled Using Inquiry-based Learning Modules to Vertically Integrate Core Biological Concepts into the Biology Majors Curriculum, including $2500 to hire an outside consultant to develop assessment tools for this program. An on-site visit by tow assessment experts occurred in FA11. Curriculum has been incorporated into Bio3120 and Bio3800, two majors courses , and will be expanded into freshman biology (BIO1100) and biostatistics (BIO4750). The projected NSF grant will include $45K for assessment. This proposal is designed to implement inquiry-based learning techniques to bring integrative learning to our core biology curriculum. It includes a vertically integrated curriculum to reinforce the concept that modern biological research requires input and skills in different sub-fields within biology. The topic infused into the curriculum is global warming, with distinct aspects of fish ecology laboratory exercises infused into several core courses. The integration of these inquiry-based modules into multiple core requirement courses will serve to reinforce the use of important skills in critical analyses, thus making it more likely that the students can achieve the high transfer. II. Exit Surveys: Results and Trends (Appendix 3) Eighty six graduating seniors submitted exit surveys this year (>90 of the FY13 graduating class). Surveys were distributed to students by email using Survey Monkey. Obvious strengths regarding BIO faculty included knowledge of subject, organization, helpfulness, attitude, (>94% agree rate in each category) and laboratory exercise appropriateness (84% agree rate) . Concerns identified include (as in past years) helpfulness of academic advisors and helpfulness of BIO faculty in career choice (63% and 45% students gave positive ratings, respectively), although ratings improved substantially from 3 years ago in the latter category (from 29%). Students involved in research projects showed strong positive responses to academic preparation (84% positive), equipment availability (88% positive), research interest (92% positive), value of the research experience (69% positive). and increased desire to pursue a graduate degree (51%). Assessment of facilities by students were mixed. Participation in honor societies, Botany Club, and the Fish and Wildlife Ecology Club has dropped from 73% to 53%. Most respondents (87%) reported that they made the right choice in selecting the Biological Sciences. Internship experiences were generally strong, with a 73% positive rating of ratings of on-site supervision and preparation for graduate school or job placement success (dropping from 100% in both categories to 73% and 83%, respectively) compared to previous years. PART THREE Summarize changes and improvements in curriculum, instruction, and learning that have resulted from the implementation of your assessment program. How have you used the data? What have you learned? In light of what you have learned through your assessment efforts this year and in past years, what are your plans for the future? Exit Survey- Biological Sciences began administering the exit survey electronically via Survey Monkey in 2010, but response rate was initially low. This year, the survey was sent out during finals week to increase participation and an on-site exit interview was made mandatory. This resulted in an increase from 32 to 86 respondents. . In addition, survey questions were expanded to assess post-graduation plans and student comments about the program. Results from this survey are used to assess student satisfaction with faculty, program, equipment, internship and research experiences and club participation. Biology Forum (BIO 1150) course was added to the BIO core five years ago, and thus most graduating students would have taken this course. The course is designed to provide a broad overview of career paths and employment opportunities in the biological sciences, as well as undergraduate research opportunities. Attendanceat and summary of a departmental research seminar is required. Exit survey results do not indicate an obvious effect in response to the question of BIO assistance in deciding on a career (question #7 in Ext Survey). The assessment committee will address this issue in AY14. Integrative learning- The Department of Biological Sciences was awarded the Provost’s Integrative Learning Award in 2011 for high impact experiences (undergraduate research, internships, volunteerism). Students involved in research experiences was very high in BIOBIO (94 students during FY13) , although only 50% of graduating students completed at least one semester of research. This lower number likely more adequately reflects the student population since the number of respondents more than doubled this year. Bio faculty will be encouraged to increase student research opportunities. Curriculum change- The PIF project , entitled Using Inquiry-based Learning Modules to Vertically Integrate Core Biological Concepts into the Biology Majors Curriculum (describe in part I above). The first phase of this project has been piloted and will be expanded over the next year, including the assessment tools used. Appendix 2. Data interpretation Assessment A. ASSESSMENT QUESTION SET Assessment #1v3 Name: _______________________________________________________ Gender: M / F Ethnic Identity (optional): ___________________ Current Class Standing: Freshman / Sophomore / Junior / Senior Please check the Biology courses that you have completed and indicate your final grade for that course. If you have repeated a particular course, enter the best grade from the repeats. If you are currently taking a course, enter “on-going” under Final Grade. Are you a transfer student (circle one)? YES * NO *If you are a transfer student, indicate the result of the equivalent course you have taken if you receive credit from those courses. A. ASSESSMENT QUESTION SET (page 2 of 5) Course Semester/Year Final Grade BIO1100: General Biology BIO1150: Biology Forum BIO1200G: General Botany BIO1300G: Animal Diversity BIO3120/BIO3100: Molecular and Cell Biology BIO3200: Genetics BIO3510: Animal Physiology BIO3520: Plant Physiology BIO3800: Ecology BIO4750/MAT2250G: Biometrics/Statistics BIO4984: Evolution Suppose you are a scientist investigating the use of alternate sources of energy, and your focus is on the use of certain types of algae that can produce useable fuel from biological sources, also known as biofuel. One of your colleagues managed to isolate a type of alga (algae are aquatic unicellular photosynthetic organisms) from a lake where the annual average temperature is 8oC. You are in a team to study whether this new type of algae might make a suitable candidate as a source of biofuel, because the oil produced by alga to regulate their osmotic balance can be extracted and converted to fuel. The following graph depicts the reading of temperature at the lake over a 12-month period. Each month, 4 different recordings are made and the average for those 4 readings are used to represent the temperature of that month. A. ASSESSMENT QUESTION SET (page3 of 5) Lake Water Temperature Average Temperature (degree Celcius) 18 16 14 12 10 8 6 4 2 0 Jan Feb Mar Apr May Jun Jul Aug Sep Oct Nov Dec Month Figure 1. Average lake water temperature. Each bar represents the average of 4 readings from the indicated month. The vertical lines represent the standard deviation. Q1. How many months have a monthly average temperature that is at or above the annual average? Explain your answer. Q2. Compare and contrast the average temperature of May to the average temperature of June. How are they similar, and how are they different? What do the similarity and difference mean? Explain your answer. Q3. In order to study this new alga to assess whether it is a suitable candidate for biofuel production, your first task is to find a way to grow it in abundance under laboratory conditions. To achieve this, you will need to know the temperature at which this organism will grow the best. A. ASSESSMENT QUESTION SET (page 4 of 5) A. Given what you know about the annual average temperature as well as the monthly average temperature of the lake from which this alga was found, formulate a hypothesis of the effects of temperature on the rate of growth of this alga. Provide an explanation to justify your hypothesis. B. Design and describe an experiment that will allow you to test the hypothesis you proposed in part (A). Be sure to identify the relevant variables. C. Provide the predicted outcomes of your proposed experiment, as well as your interpretation of these potential outcomes. Be sure to include sufficient detail to justify your explanation. The next step in determining whether this new alga is a suitable candidate for biofuel production is to examine the amount of oil produced by this alga under different conditions. You decide to investigate the impact of salinity on the production of oil from this alga by quantifying the amount of oil produced by the alga when it is grown under different concentrations of sodium chloride (NaCl). This experiment was done with 2 liters of algal culture per condition. The summary of your data is presented below. NaCl concentration (mM) 1 10 25 40 Alga mass (g/L) 5.2 4.9 2.2 0.7 Oil (% of algal mass) 12.7 22.9 46.1 61.8 Q4. Based on the data from this table, which salt concentration gives the largest amount of oil per liter? Show your work and explain your answer. The colleague who identified this alga also managed to collect data on the abundance of this alga from the lake throughout the year. Along with counting the alga, she had also performed a count for total invertebrates of the same sample. The data that she had collected is presented in the table below. A. ASSESSMENT QUESTION SET (page 5of 5) Month Total Alga Mass (g/L) Total Invertebrate Mass (mg/L) January 4.57 21.71 February 4.19 22.34 March 10.22 44.91 April 8.87 34.39 May 7.72 36.66 June 2.91 13.14 July 2.65 12.28 August 2.11 9.84 September 5.55 12.78 October 10.87 26.45 November 8.87 35.44 December 6.12 28.17 Table 1. Total algal mass and total invertebrate mass at the lake. Q5. Produce a graphical representation of the data in the table above. You may either hand draw it in the space below, or you may use a software like Excel to produce the graph. Q6. Using the data from both Figure 1 and the graph that you have just created, propose a hypothesis concerning the population change of the invertebrates of this lake. Explain your hypothesis. B. TUES RUBRIC ANSWER SET Q1: According to the graph 7 months had an average temperature of 8oC or above, but only 4 months including standard deviation bars. Q2: The average temperature of June is more accurate than that of May both at 12oC because the error bar in May is highly greater than that of June. Q3A: Higher average temperatures should be efficient in algae growth by providing more sunlight for photosynthesis to be successful. In lower temperature months there may not be valuable sunlight to aid in growth of the algae. This will also lead to the production of biofuel due to higher osmotic pressure. Q3B: Growing algae in the presence of efficient sunlight water and also controlling in with algae in cooler water with less sunlight over a full month. Q3C: Since algae are photosynthetic unicellular organisms they cannot survive in the absence of sunlight so therefore since the algae in warmer water and more sunlight will survive and therefore producing more biofuel. Q4: The 1 mM NaCl gave the highest percentage of oil per liter: 52/127 = 0.409 Q6: The population change of the invertebrates of the lake seemed to be fairly standard. Invertebrates with higher (mg/L) mass seemed to have the same high total algae mass (g/L) while invertebrates of lower mass were vice versa. C. TUES RUBRIC FOR SCORING (page 1of 2) C. TUES RUBRIC FOR SCORING (page 2 of 2) D. TUES RUBRIC RESULTS –Spring 2012 Q1 Q2 Q3A Q3B Q4A Q4B Q5 Q6 Appendix 3. Scientific Poster Assessment
