Jonathan-Holmes-WATER-QUA...Y
advertisement
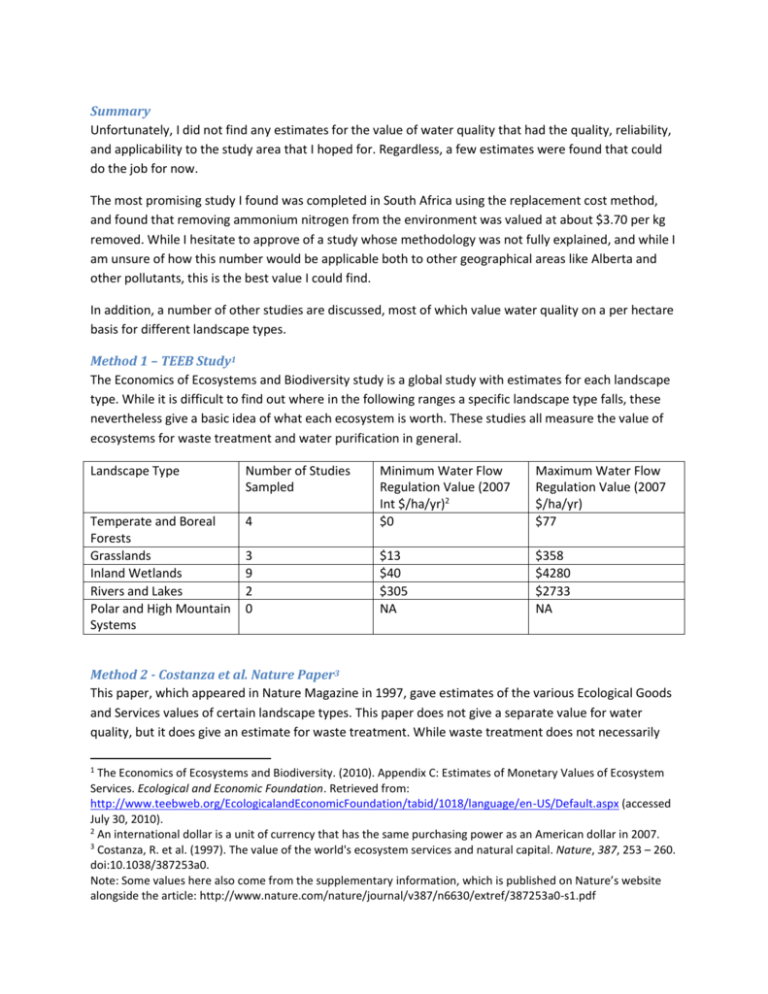
Summary Unfortunately, I did not find any estimates for the value of water quality that had the quality, reliability, and applicability to the study area that I hoped for. Regardless, a few estimates were found that could do the job for now. The most promising study I found was completed in South Africa using the replacement cost method, and found that removing ammonium nitrogen from the environment was valued at about $3.70 per kg removed. While I hesitate to approve of a study whose methodology was not fully explained, and while I am unsure of how this number would be applicable both to other geographical areas like Alberta and other pollutants, this is the best value I could find. In addition, a number of other studies are discussed, most of which value water quality on a per hectare basis for different landscape types. Method 1 – TEEB Study1 The Economics of Ecosystems and Biodiversity study is a global study with estimates for each landscape type. While it is difficult to find out where in the following ranges a specific landscape type falls, these nevertheless give a basic idea of what each ecosystem is worth. These studies all measure the value of ecosystems for waste treatment and water purification in general. Landscape Type Number of Studies Sampled 4 Minimum Water Flow Regulation Value (2007 Int $/ha/yr)2 $0 Maximum Water Flow Regulation Value (2007 $/ha/yr) $77 Temperate and Boreal Forests Grasslands Inland Wetlands Rivers and Lakes Polar and High Mountain Systems 3 9 2 0 $13 $40 $305 NA $358 $4280 $2733 NA Method 2 - Costanza et al. Nature Paper3 This paper, which appeared in Nature Magazine in 1997, gave estimates of the various Ecological Goods and Services values of certain landscape types. This paper does not give a separate value for water quality, but it does give an estimate for waste treatment. While waste treatment does not necessarily 1 The Economics of Ecosystems and Biodiversity. (2010). Appendix C: Estimates of Monetary Values of Ecosystem Services. Ecological and Economic Foundation. Retrieved from: http://www.teebweb.org/EcologicalandEconomicFoundation/tabid/1018/language/en-US/Default.aspx (accessed July 30, 2010). 2 An international dollar is a unit of currency that has the same purchasing power as an American dollar in 2007. 3 Costanza, R. et al. (1997). The value of the world's ecosystem services and natural capital. Nature, 387, 253 – 260. doi:10.1038/387253a0. Note: Some values here also come from the supplementary information, which is published on Nature’s website alongside the article: http://www.nature.com/nature/journal/v387/n6630/extref/387253a0-s1.pdf always refer to improving water quality, in practice they almost always have at least some component which does. Landscape Type Location of Studies Temperate /Boreal Forest Grassland /Rangeland Inland Wetlands (Swamps and Floodplains) Lakes and Rivers Global (1 study) Global (1 study) USA, Sweden, Austria (4 studies) USA (1 study) Average Waste Treatment Value (1994 US $/ha/yr) 10 87 1659 Minimum Waste Treatment Value (1994 US $/ha/yr) 10 87 263 Maximum Waste Treatment Value (1994 US $/ha/yr) 10 87 5626 665 95 1235 Method 3 –Replacement Cost Values One promising way of valuing the water quality improvements provided by a specific ecosystem is to estimate the total costs incurred if the exact same service were provided by a water treatment plant. This strategy makes use of the replacement cost method, where an ecosystem service is valued based on the cost of the least expensive man-made alternative. Since technology and therefore treatment costs are relatively similar across Canada, this method has the advantage of providing estimates which would be very easily transferred to other study areas. However, the replacement cost method is a less precise measurement of value than other estimation techniques. The replacement cost method can underestimate the value of a service, in which case the consumer would still receive a huge surplus value from the next best alternative (if you want to determine the consumer surplus for an item, other measures are preferable to this one). On the other hand, the value of the service can also be less than the value of the closest substitute (silly example: Spiders provide a service by killing annoying bugs and thereby making dinners more enjoyable. A replacement value for the spider could be the cost of a bug zapper. However, if all the spiders in my yard were suddenly hit with a disease and died, I still probably wouldn’t buy a zapper, because I don’t actually mind bugs that much. In this case, calculating the replacement cost of the zapper overestimates the value of the bug-killing service which spiders provide to me). Regardless of these issues, the replacement cost method is a well established and easy method for estimating service values which cannot otherwise be calculated. To calculate the total replacement cost of an ecosystem in its water filtration role, a few pieces of information are needed. First, a reasonable estimate of the total quantity of a pollutant or pollutants filtered by the ecosystem is needed. To estimate the cost of filtering out an equivalent quantity of pollutants at a man-made system, one method is to gather the total costs of water filtration and total quantity of pollutants removed from the water from a number of different plants. Multiple regression analysis is then used to isolate the effect of increased pollutant filtration on plant costs. A second method would be to survey a plant operator on their costs over the course of a year, to determine how much costs increase when seasonal pollution is highest. Unfortunately, I was not able to find many studies which estimate the total costs to plants to remove common pollutants. The most relevant was a study in South Africa, which estimated that the cost of removing ammonium nitrogen is about ZAR 26 per kilogram removed (approx CAD $3.70).4 Unfortunately, the explanations in this paper on how this number was estimated were brief, and I find it hard to confirm the validity of this estimation. Also, since the quantity of ammonium nitrogen removed is highly correlated in practice to other types of pollutants removed, the dollar figure cited above probably captures the increased cost of removing other types of pollutants. Given that it is only one study with few associated details, it would be hard to generalize this finding to more holistic measures of water quality in other areas. A second study took a quite different approach. Instead of comparing the costs of water treatment to the quantity of pollutants removed, it compared the costs of treatment to the quantity of forested area in the source watershed. What it found was that for every 10% increase in forest cover, there was a 20% decrease in water treatment costs.5 The following table is taken straight out of that report: As you can see in this table, the absolute costs of losing forest cover increase as the total forest cover decreases. So, moving from 60% forest cover to 50% forest cover will be less costly than moving from 20% to 10% in absolute terms. To calculate the marginal value of losing forested land, simply compare the cost per gallon before and after the change in forested land. Calculating a rough value for a hectare of forest is more difficult, because this value should in theory grow higher as more forests are removed. However, a rough estimate could be achieved using the following formula: 4 Turpie, J. Day, E. Ross-Gillespie, V. & Louw, A. (2010). Estimation of the Water Quality Amelioration Value of Wetlands: A Case Study of the Western Cape, South Africa. Environment for Development Discussion Paper 10-15. http://www.efdinitiative.org/research/publications/publications-repository/estimation-of-the-water-qualityamelioration-value-of-wetlands-a-case-study-of-the-western-cape-southafrica/?searchterm=Estimation%20of%20the%20Water%20Quality%20Amelioration%20Value%20of%20Wetlands (accessed August 18, 2010). 5 Ernst, C. Gullick, R. & Nixon, K. (2004). Protecting the Source: Conserving Forests to Protect Water. Opflow 30, 5. http://www.ci.slc.ut.us/utilities/NewsEvents/pdf/Op0504_1.pdf (accessed August 18, 2010). 𝑽𝒂𝒍𝒖𝒆 𝒐𝒇 𝒂 𝒉𝒆𝒄𝒕𝒂𝒓𝒆 𝒐𝒇 𝒇𝒐𝒓𝒆𝒔𝒕 −∆ 𝒄𝒐𝒔𝒕𝒔 𝒑𝒆𝒓 𝒈𝒂𝒍𝒍𝒐𝒏 ( ) ∗ 𝑪𝒖𝒓𝒓𝒆𝒏𝒕 % 𝒇𝒐𝒓𝒆𝒔𝒕𝒆𝒅 ∗ # 𝑮𝒂𝒍𝒍𝒐𝒏𝒔 𝑻𝒓𝒆𝒂𝒕𝒆𝒅 ∆ %𝒘𝒂𝒕𝒆𝒓𝒔𝒉𝒆𝒅 𝒇𝒐𝒓𝒆𝒔𝒕𝒆𝒅 = 𝑪𝒖𝒓𝒓𝒆𝒏𝒕 𝒏𝒖𝒎𝒃𝒆𝒓 𝒐𝒇 𝒇𝒐𝒓𝒆𝒔𝒕𝒆𝒅 𝒉𝒆𝒄𝒕𝒂𝒓𝒆𝒔 The first term in the numerator is an arbitrary change (I suggest a 10% reduction from current forested levels). This formula assumes that the value of a hectare of forest is linearly related to the total treatment costs – which is an invalid assumption according to the data above, but does not drastically change the answer, and is a necessary assumption in order to come up with a single figure for value per hectare instead of a formula. The problem with this method is that it tells us nothing about other landuses or landscape types. For example, this method cannot predict the value of a farming best practice which reduces only nitrogen runoff, nor can it give us a value for wetlands upstream of Calgary. In sum, I was able to find two replacement cost studies for water quality improvements. Both studies could be used for now, but neither is ideal. Other Studies The main issue with these studies is that many different measurements are used, and consequently it is hard to compare them to each other. Some measure the value of a specific pollutant, others value a qualitative change in the quality of water, and still others use water quality standards that differ from region to region. These estimates could be useful for the Upper Bow Basin study, but some digging would be necessary to convert these values into meaningful estimates would be necessary. To compliment the value of forests that can be derived above, the WWF publication “The Economic Values of the World’s Wetlands estimates approximate per hectare values of wetlands. This meta analysis found that the median value for water filtering was $288 per hectare. Mathews, Homans and Easter found that a 40% reduction in phosphorous in the Minnesota River was associated with a willingness to pay of $14.07-$38.88 per nearby resident. (See EVRI reference file)6 The USDA has compiled a large number of estimates for various water quality improvements. For example, they have estimated the value a small reduction in water salinity, as well as the value of increasing water quality from “boatable” to “fishable” and from “fishable” to “swimable.”7 6 Mathews, L.G., Homans, F.R., & Easter, K.W. (1999). Reducing Phosphorus Pollution in the Minnesota River: How Much is it Worth? Working Paper (Staff Paper P99-4, Department of Applied Economics, College of Agricultural, Food, and Environmental Sciences, University of Minnesota) See the EVRI study for more details (document in EGS folder). 7 Koteen, J., Alexander, S. J., & Loomis, J. B. (2002). Evaluating Benefits and Costs of Changes in Water Quality. United States Department of Agriculture, Forest Service Technical Report. http://www.fs.fed.us/pnw/pubs/gtr548.pdf (accessed August 18, 2010). Estimated that a one percent increase in the number of “good” (as defined using the US EPA standards) lakes and rivers in the US was valued at an average of $32 per capita.8 8 Viscusi, W. K., Huber, J. & Bell, J. (2007). The Economic Value of Water Quality. Environmental and Resource Economics, 41, 2, 169-187. DOI: 10.1007/s10640-007-9186-4
