RTI 2 Early Warning System
advertisement
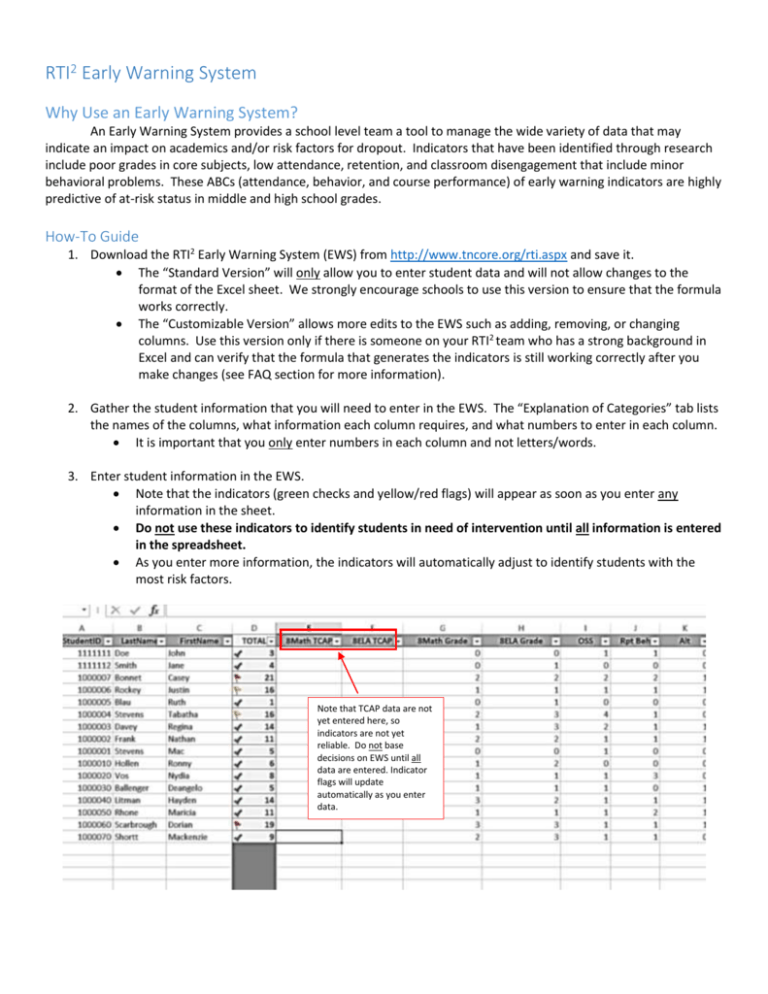
RTI2 Early Warning System Why Use an Early Warning System? An Early Warning System provides a school level team a tool to manage the wide variety of data that may indicate an impact on academics and/or risk factors for dropout. Indicators that have been identified through research include poor grades in core subjects, low attendance, retention, and classroom disengagement that include minor behavioral problems. These ABCs (attendance, behavior, and course performance) of early warning indicators are highly predictive of at-risk status in middle and high school grades. How-To Guide 1. Download the RTI2 Early Warning System (EWS) from http://www.tncore.org/rti.aspx and save it. The “Standard Version” will only allow you to enter student data and will not allow changes to the format of the Excel sheet. We strongly encourage schools to use this version to ensure that the formula works correctly. The “Customizable Version” allows more edits to the EWS such as adding, removing, or changing columns. Use this version only if there is someone on your RTI2 team who has a strong background in Excel and can verify that the formula that generates the indicators is still working correctly after you make changes (see FAQ section for more information). 2. Gather the student information that you will need to enter in the EWS. The “Explanation of Categories” tab lists the names of the columns, what information each column requires, and what numbers to enter in each column. It is important that you only enter numbers in each column and not letters/words. 3. Enter student information in the EWS. Note that the indicators (green checks and yellow/red flags) will appear as soon as you enter any information in the sheet. Do not use these indicators to identify students in need of intervention until all information is entered in the spreadsheet. As you enter more information, the indicators will automatically adjust to identify students with the most risk factors. Note that TCAP data are not yet entered here, so indicators are not yet reliable. Do not base decisions on EWS until all data are entered. Indicator flags will update automatically as you enter data. 4. After entering all student information, use the indicators to identify students in need of intervention. Students with a red flag next to their total number of risk factors are the most at risk. Their number of risk factors was in the top 10% of your school; these are your Tier 3 students. Students with a yellow flag had the next highest number of risk factors. Their number of risk factors was in the top 25% of your school; these are your Tier 2 students. Students with a green check had the fewest risk factors; these are your Tier 1 students. 5. You can use the sort and filter functions to change how you view your data. You can filter by color to only view students with red or yellow flags. Click on this arrow to see the sort and filter options. You can sort the list to see students ranked by number of risk factors. Select “Sort A to Z” to rank students by number of risk factors. 6. Save your EWS. Any student information you enter in the EWS will cause the formula that calculates the indicators to update automatically. We strongly suggest that, if you want to go back and add in more data, you make a copy of your original spreadsheet and make changes in the copy. That way, your original spreadsheet is always available if you need it. To make a copy, right-click on the tab at the bottom of your EWS. Select “Move or Copy,” then click the “Make a Copy” box. Right-click on the tab of the sheet in which you have entered your EWS data. FAQs Who should enter this data? It will vary by school. If there are several hundred or fewer students per grade, it may be feasible to have one person designated to enter all information for each grade. If your school is much larger, it may be easier to ask each teacher to enter information for his/her homeroom, for example, or split the task among members of the RTI2 team. Where do I find this data? Schools can access almost all of the necessary data from their student information systems (e.g., PowerSchool, Skyward, EduPoint, INOW, Follett). Information about students that have had contact with the juvenile justice system will likely come from attendance managers or school resource officers. How did the state decide to use the categories (columns) that it did? A team of national RTI experts, including Drs. Mark Shinn and Alan Coulter, reviewed research on RTI implementation in high schools and supported the use of these categories as useful measures to identify students at risk of academic failure and/or dropout. The first step toward identifying those students who are at risk for school disengagement and dropout is to track and analyze data that indicate early warning signs. Indicators that have been identified through research include poor grades in core subjects, low attendance, retention, and classroom disengagement that include minor behavioral problems. These ABCs (attendance, behavior, and course performance) of early warning indicators are highly predictive of at-risk status in middle and high school grades. Do I have to enter data in every column? No. Even if you are using the Standard Version of the spreadsheet, you can choose to ignore certain columns. For example, if you do not have data on whether or not students received tiered interventions in elementary or middle school, simply skip entering any data in that column. Leaving a column blank will not negatively affect the formula. What if I want to add or change columns? Use the Customizable Version of the spreadsheet to add or change columns. If you do, be certain that the formula in the TOTAL column extends to any new columns you add. The standard formula is: =IF(SUM(E2:R2)=0,"",SUM(E2:R2)) If you add columns that extend beyond R, be sure to update the formula. For example, if you add two columns and your data now extend to column T, the formula should read: =IF(SUM(E2:T2)=0,"",SUM(E2:T2)) Make sure to extend the formula down the entire TOTAL column. It’s important to maintain the formula throughout this entire column because otherwise, rows that have no entries count as zeroes and skew the data that determine the indicators. How often should I update the EWS? Each year, enter data for the incoming freshman class. EWS data should also be updated for new students entering your system/school as needed. Schools are encouraged to also review updated information on students in grades 10-12 who received interventions in the prior school year. We’ve put in all our student data. Now what? 1. Data teams should analyze data to identify the risk factors and develop a plan of intervention to address those factors. 2. Review progress monitoring data weekly/bi-weekly to determine progress and guide intervention placements. 3. Appropriately leverage resources to serve students who are at risk of academic failure. Who should I contact if I run into problems using the EWS? TDOE contacts include: Suzanne.Keefe@tn.gov and Lisa.Coons@tn.gov for questions about RTI2 implementation Amy.Owen@tn.gov for technical questions about the EWS.
