Analysis of graduation rates 8_18_11 rev
advertisement
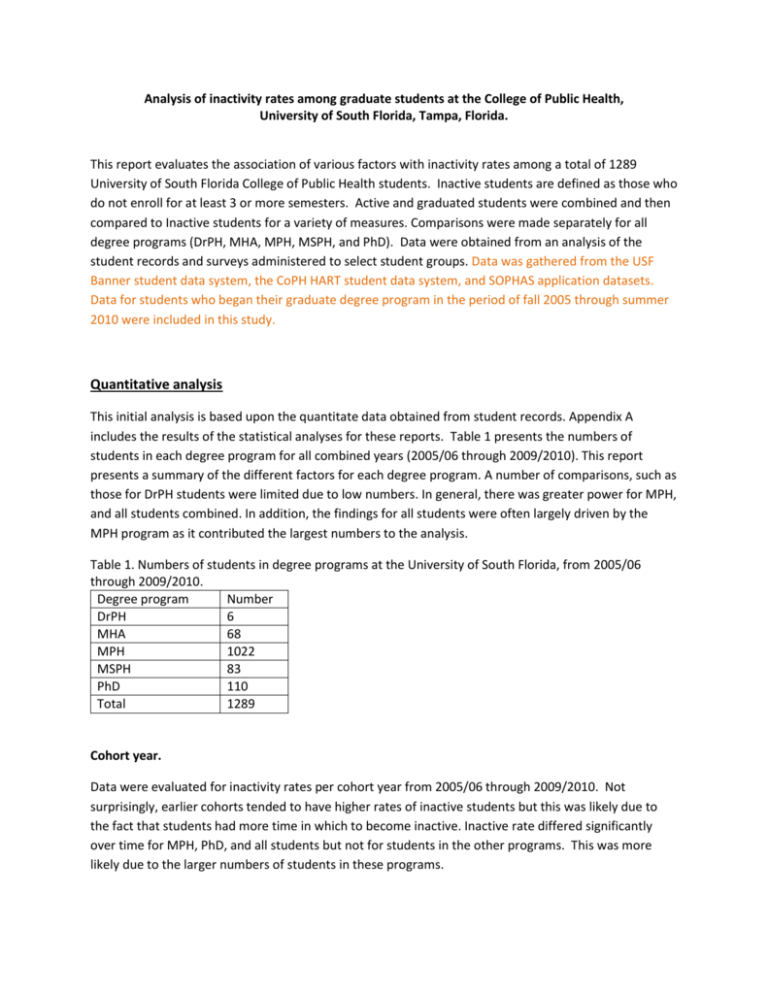
Analysis of inactivity rates among graduate students at the College of Public Health, University of South Florida, Tampa, Florida. This report evaluates the association of various factors with inactivity rates among a total of 1289 University of South Florida College of Public Health students. Inactive students are defined as those who do not enroll for at least 3 or more semesters. Active and graduated students were combined and then compared to Inactive students for a variety of measures. Comparisons were made separately for all degree programs (DrPH, MHA, MPH, MSPH, and PhD). Data were obtained from an analysis of the student records and surveys administered to select student groups. Data was gathered from the USF Banner student data system, the CoPH HART student data system, and SOPHAS application datasets. Data for students who began their graduate degree program in the period of fall 2005 through summer 2010 were included in this study. Quantitative analysis This initial analysis is based upon the quantitate data obtained from student records. Appendix A includes the results of the statistical analyses for these reports. Table 1 presents the numbers of students in each degree program for all combined years (2005/06 through 2009/2010). This report presents a summary of the different factors for each degree program. A number of comparisons, such as those for DrPH students were limited due to low numbers. In general, there was greater power for MPH, and all students combined. In addition, the findings for all students were often largely driven by the MPH program as it contributed the largest numbers to the analysis. Table 1. Numbers of students in degree programs at the University of South Florida, from 2005/06 through 2009/2010. Degree program Number DrPH 6 MHA 68 MPH 1022 MSPH 83 PhD 110 Total 1289 Cohort year. Data were evaluated for inactivity rates per cohort year from 2005/06 through 2009/2010. Not surprisingly, earlier cohorts tended to have higher rates of inactive students but this was likely due to the fact that students had more time in which to become inactive. Inactive rate differed significantly over time for MPH, PhD, and all students but not for students in the other programs. This was more likely due to the larger numbers of students in these programs. Department There was a statistically significant different in departmental inactive rates for MPH (p=0.001) and all students (p<0.001), and a borderline result for PhD students, (p=0.096). In terms of MPH students, the lowest inactivity rate is for Global Health Students and the highest is for Public Health Practice students. For PhD students the highest rates of inactivity are for HPM students (33.3%) and lowest for EOH students (15.0%). Public Health Practice students generally are working full time in the field of public health and may have greater needs for support as they juggle employment, family, and school. A quantitative survey may identify ways in which the college could better support these students. Add analysis of the weekend vs. totally online PHP students here. Demographic factors There are no significant findings for gender or ethnicity. Inactivity rates are slightly higher for men but this is not significant. The association of ethnicity with inactivity rates was of borderline significance in PhD students (p=0.070), with the highest rates noted in Hispanic students (27.3%. vs. 11.1% for Black and 6.9% for white students). Age was significantly associated with inactivity rates for MPH students (p<0.001) and was borderline for PhD students (p=0.089), but in all cases inactive students were more likely to be older students than active students. This may reflect the greater family demands experienced by older students, and identify an area where increased support may be helpful. Citizenship and residency There are differing findings on the effect of citizenship and residency on academic inactivity rates. While citizenship was not significantly associated with inactivity status, Florida residency was significant for MPH and total students (p=0.016 and 0.014, respectively), and a borderline finding for MSPH students (p=0.105). For MPH students, Florida residents had higher rates of inactivity than non-Florida residents (25.0% vs. 19.1% , respectively). Only 9.7% of non-resident MSPH students were inactive as compared to 23.1% of Florida residents. Family history of academic success. Neither being the first in the family to obtain an undergraduate degree or first in the family to be enrolled in a graduate program were associated with increased inactivity rates. Admission factors Undergraduate GPA was ONLY significantly associated with inactivity for MHA students (p=0.031), although overall inactive students tended to have slightly lower undergraduate GPAs but differences were slight. The University may admit up to 10% of new enrollees as exceptions to the Board of Trustees minimum requirements. To be considered for an exception, a student should present evidence that their academic preparation was such that it might account for less than the minimal University and/or program requirements, and evidence of potential for academic success. It is the discretion of the program and college to accept exception application requests. There were no significant differences in inactivity rates between students admitted under the 10% exception rule, indicating that this policy does not seem to increase student inactivity rates. The association of GREs scores is mixed. The verbal GRE score was significantly associated with academic inactivity for MPH students (p=0.013), with inactive MPH students having a mean score of 464.64 as compared to 487.24 for active/graduated students. It was not associated with inactivity for any of the other programs. The quantitative GRE score was of borderline significance for PhD students (p=0.059) but surprisingly inactive students had higher quantitative scores. Inactive students have a mean quantitative score of 672.86 as compared to 625.06 for active students. Years since attainment of an undergraduate degree was significantly associated with higher levels of inactivity among MPH student with inactive students having a mean of 6.8 years as compared to 5.4 for active students (p=0.016). This result was not significantly associated for MHA, MSPH and PhD although students who became inactive had the same trend of higher years for inactive than active students. Academic Success Academic success is strongly associated with inactivity rates and could be an area in which interventions to improve student performance can be developed. Current overall GPA was significantly associated with inactivity rates for students in the MHA, MPH, MSPH, and PhD program (p<0.001 for each analysis). Not surprisingly students with a lower GPA were more likely to become inactive than students with a higher GPA. Probation was highly significant for all programs but could not be evaluated for the DrPH as there are no students DrPH students on probation. Any student who does not maintain an overall minimum GPA of 3.0 (on a 4.00 scale) in all courses taken as a graduate student and in each of the student’s degree-seeking programs at the end of a semester shall be considered on probation as of the following semester. Students with a GPA below 3.0 for two consecutive semesters are moved to probation status two and after three consecutive semesters are moved to probation status three. For this study, students on any probation status were considered on probation. Overall 73.5% of students on probation go on to inactive status as compared to 17.3% of students not on probation. This may be partially due to the fact if students drop out mid semester and do not complete work during that semester they are more likely to be put on probation. But clearly this association identifies an area which can be addressed and demonstrates the importance of successful academic achievement in remaining as an active student or successful graduate. Faculty currently work with students on probation to develop a plan for improving their GPA. Additional surveys with students on probation may be useful to identify factors associated with inactivity, which could be used by faculty in developing these plans. Grades in PHC 6000 Epidemiology) and PHC 6050 (Biostatistics), two core courses were strongly associated with inactivity rates. Grades in PHC 6000 (Epidemiology) were significantly associated with inactivity rates for MPH students and of borderline significance for MSPH students. Inactive MPH students had a mean grade of 2.7 compared to 3.1 for active MPH students. Inactive MSPH students had a mean grade of 2.8 as compared to 3.1 for active students. Grade in PHC 6050 (Biostatistics) was significantly associated with inactivity rates for MPH and MSPH students. Inactive MPH students had a mean grade of 2.9 compared to 3.2 for active MPH students. The difference was even greater for MSPH students but there were smaller numbers of students in this program. Inactive MSPH students had a mean grade of 2.6 as compared to 3.5 for active students. PHC 6000 and PHC 6050 grades were further evaluated by department among MPH students. While in general, active students had higher grades in PHC 6000 and PHC 6050, there were no significant associations found for students in Community and Family Health, Environmental and Occupational Health, or Global Health. There was a borderline association with inactivity among students in Environmental and Occupational Health (p=0.103) for PHC 6000 (Epidemiology), with inactive students having a grade of 2.6 as compared to 3.1 for active students. In contrast, grades in PHC 6000 (Epidemiology) and PHC 6050 (Biostatistics) were strongly associated with inactivity rates for students majoring in Epidemiology and Biostatistics, as well as students in Health Policy and Management. There was also a significant association between inactivity and PHC 6000 (Epidemiology) for Public Health Practice students but not for 6050 (Biostatistics). Given the importance of these two core courses in predicting academic success, it would be useful to identify ways to target students at risk of doing poorly in these courses and offer an alternative. We currently have undergraduate courses in Epidemiology and Biostatistics and incoming students who do not have a sufficient background could be encouraged to take these courses prior to enrolling in the graduate level coursework in epidemiology and/or biostatistics. Further analysis of predictors of success in these courses at admission might be useful to determine which students would benefit from starting out with our undergraduate courses in these two areas. Potential areas to evaluate are students with low undergraduate grades in statistics or math courses, low quantitative GREs, and potentially low verbal GREs. Financial Issues There are limited data on financial issues related to academic success. We were able to identify students who had received support from USF and other sources, as well as students employed by USF. Financial data were collected for the 2005/06 cohort of students for their first three years. From this data three variables were created for analysis: Financial support from USF; Financial support from other sources; Employment at USF. Financial support from USF included any form or amount of support including COPH or USF tuition waivers, scholarships, grants, traineeships, and exemptions such as graduate school fellow, sponsored institute, state employee. The other financial support variable included support from non-USF sources such as federal or V.A. loans or other scholarships. The employment variable indicated if they were employed by USF for at least one semesters during the three year period. Analyses of these issues is limited to MPH students as they represent the larger category of students. For MPH students, we found that having USF support in the first year was significantly associated with lower inactivity rates, with 18.7% of supported students inactive as compared to 36.6% of non-supported students inactive(p=0.01). A similar finding was obtained for three years of support, with supported students significantly less likely to become inactive, 15.4% vs. 42.1% for inactive students(p<0.001). Other support in the first year or first three years were not associated with any significant differences in inactivity rates. While financial support is clearly associated with success at USF, it is difficult to identify the direction of effect, as students identified on admission as eligible for financial support may be stronger candidates, and thus they were more likely to succeed with or without support. Employment as USF was also associated with decreased rates of inactivity, but this finding was only significant for three years of employment. MPH students at USF who were employed in the first year had a 20% inactivity rate as compared with non USF employed student with an inactivity rate of 32.3% (p=0.18). MPH students at USF who were employed in the first three years had a 18% inactivity rate as compared with non USF employed student with an inactivity rate of 33.8% (p=0.024). Again being selected for employment is not random as generally the stronger students or those with more skills were more likely to be employed. Qualitative analysis Surveys were sent to 33 active students approaching inactivity (2 consecutive inactive semesters) and 28 active students who had once been inactive. Responses are given in the format of respondent number and their open ended response. An email was sent to each participant with a link to the online survey on July 14. A reminder email was sent six days after the original email. There were a total of 8 responses to the surveys (4 each) so it is difficult to draw many conclusions. Responses sent by 7/26/11 are listed below. From students who have been inactive for two consecutive terms and will go inactive if they do not enroll in the next term (sent to 33 active students) What is the primary reason you have stopped enrolling in courses for your program? 1. My class portion is complete, but I have not completed my fieldwork. Sorry! 2. Requirements for full time along w full time job are too intense. 3. There are two reasons that I stopped enrolling in courses for my program. First, I am an army reservist and recently involved with drills and trainings. I will be called on activity duty in October, 2011.Second, finance is my big problem. I don’t have personal financial support to pay my tuitions. 4. Financial What could the College of Public Health have done to better support you before you stopped enrolling? 1. They are good! 2. Intolerant of questions. No support. Critical when reached out for solutions. I have a difficult time with math. Impossible online, they didn't care to assist. 3. I have very good experiences with the College of Public Health. I have to fulfill my military duties first and may request for leave of absence from the program. 4. Financial assistance Are you planning on returning to your program or attending a different program or school? 1. I plan on finishing. Thanks for the email update, I will get my act together! 2. Possibly. Not at this time. 3. I have to serve in army first and am planning on returning to my program after three year army services. 4. Yes What can the College of Public Health do to support you in returning to your program? 1. I will finish now! 2. Not sure. Online epi & other ph requirements are really difficult w a full time job. 3. Leave of absence policy in the College of Public Health will keep student returning academic semester after their excuses. 4. Financial support Do you have any other comments you would like to share? 1. I LOVED the program! 2. Your office staff are nasty over the phone and even by email. The professors were awesome. 3. No. 4. no Your GPA or Probation status 1. I have a high GPA, but haven't taken classed b/c my requirements are completed. Thanks! 2. Probation, was told I as pretty much kicked out because I had to drop epi. Gpa was actually very good. 3. My GPA is 2 from my program. 4. 3.97 From Active students who were at one time inactive (sent to 28 active students) What was the primary reason you became inactive (did not enroll for three consecutive semesters) 1. I moved for a job and at that time, USF did not offer any on-line courses in the MPH program. 2. Financial issues. 3. lack of funds 4. overseas employment and financial burden What support could the College of Public Health have offered to have prevented you from becoming inactive? 1. If distance learning courses were available, then I would not have stopped. 2. In that moment, I was not aware of the LAC scholarship. 3. scholarships? grants? 4. financial aid What can the College of Public Health do to better support you currently? 1. Nothing. 2. A TA position. 3. can't think of anything 4. offer a more flexible courses schedule and more online courses Why did you return to your program of study? 1. I wanted to finish my degree for professional advancement. 2. I always wanted to complete the program and got a university scholarship from abroad. 3. yes 4. ablity to pay for school Were there any barriers to you re-admission? 1. No. 2. Absolutely not. 3. just paperwork and delays 4. no Do you have any other comments you would like to share? 1. I think that the ACM should have been easier to qualify for. I had one person look at it one time, and determine I didn't qualify. I think that it should be reviewed by a board or something more formal. Luckily for me, my job paid for my tuition, or I would not have been able to go back to school, paying out of state tuition. 2. No, Thanks. 3. I received only one email letting me know that I would become inactive which I misunderstood. The way I read it, I thought I still had one more semester, that is my fault I know but maybe a few more emails warning me that I would become inactive would help me realize the correct info. 4. none Summary and Recommendations This analysis identified a number of key areas that were related to inactivity rates among graduate students. There was a consistent pattern that indicated students with greater home responsibilities may be at higher risk of inactivity. These included the greater inactivity rates among older students, those with more years since their undergraduate degree, and the higher rate among Public Health Practice students who often have full time employment while attending school. Advisors might be alerted to the fact that students with greater work and family responsibilities may need additional support. It would be useful if we could develop measures to identify the degree of other responsibilities and determine if this is associated with inactivity, as the data suggest. Unfortunately, our qualitative surveys had a low response rate so we were not able to obtain that data for this report. In terms of admissions, there were few strong associations. The most important finding was the association of low verbal GREs with higher inactivity rate among MPH students. Students admitted with a low verbal GRE may need additional monitoring to determine if they are succeeding, or they could be targeted for additional undergraduate courses to improve their chance of success. We might consider providing more opportunities to improve critical thinking and writing skills for students with low verbal scores, as that may increase their likelihood of success in future classes. Florida residency was associated with higher inactivity rates but the reasons for this were not clear. It was encouraging that students admitted under th10% rule did not have higher rates of inactivity, showing that the application of this rule in the admission process is successful. One of the most striking indicators for inactivity rate is current academic failure. Students with a low GPA, particularly those on probation are more likely to become inactive. We need to conduct additional analyses to determine the relationship between various levels of probation and ultimate success, as well as to identify potential preventive measures. Most student begin with core courses, and there is a currently a disparity in core course grades, with most students receiving high grades in Environmental Health, Social and Behavioral Health, and Health Policy and Management, but with a wider distribution of grades in Epidemiology and Biostatistics, the more quantitative courses. Thus, these two courses may serve as a marker of potential academic problems. There are several approaches that can be implemented. First, we need to evaluate potential predictors of poor performance in these classes. We can conduct further analyses to determine the correlation of verbal, quantitative, and writing scores with Epidemiology and Biostatistics grades, as well as the association of math scores among undergraduates to attempt to identify higher risk students. These students could be advised to take the undergraduate courses in these areas as a review before enrolling in the graduate level courses. We could also consider a baseline test of new students to determine their readiness for these classes and again use the undergraduate classes for those who show evidence of not being sufficiently prepared. The availability of these undergraduate courses offers us a real opportunity to help students better prepare for their graduate work. Secondly, students without a strong background in math and statistics courses and who are not majoring in epidemiology and/or biostatistics could be advised to take these courses in different semesters. It would be best for students to take epidemiology first and then take biostatistics second as information from the epidemiology course would provide a foundation for biostatistics. Majors in epidemiology and biostatistics who do poorly in these courses would clearly need more intensive advising. Reasons for problems could be explored and they could potentially be advised to consider alternative degree programs if needed. It was difficult to determine the impact of financial issues as we have limited data. Students receiving financial aid and employed by USF are less likely to become inactive, but often it is the higher performing students who are offered these opportunities. We were disappointed by the low response rate to our qualitative surveys as they limited our opportunity to understand the reasons for student’s inactivity rates. Limitations. We were limited to existing data and for the most part, we could evaluate correlations but not necessarily causality. However, we have a relatively strong database of student measures and were able to obtain preliminary information that will be useful in addressing these issues. We need to identify natural data collection points that would allow us to obtain much needed qualitative data on students’ and faculty perceptions of the reasons for academic failure.
