1. COASTAL GEOLOGY AND GEOMORPHOLOGY
advertisement

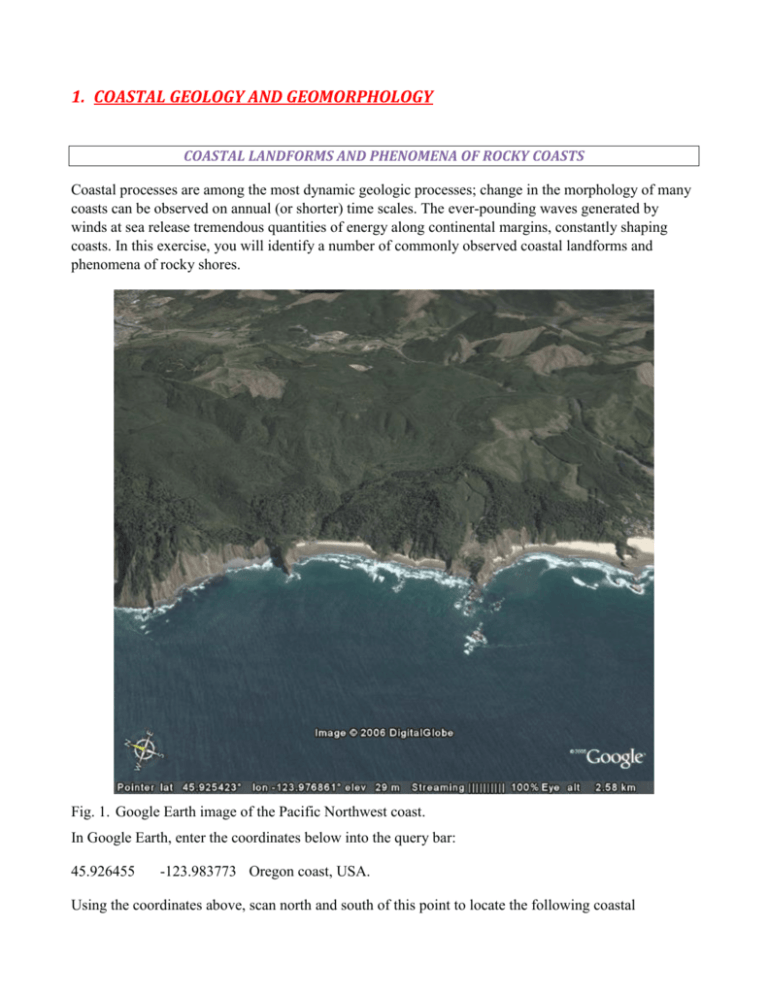
1. COASTAL GEOLOGY AND GEOMORPHOLOGY COASTAL LANDFORMS AND PHENOMENA OF ROCKY COASTS Coastal processes are among the most dynamic geologic processes; change in the morphology of many coasts can be observed on annual (or shorter) time scales. The ever-pounding waves generated by winds at sea release tremendous quantities of energy along continental margins, constantly shaping coasts. In this exercise, you will identify a number of commonly observed coastal landforms and phenomena of rocky shores. Fig. 1. Google Earth image of the Pacific Northwest coast. In Google Earth, enter the coordinates below into the query bar: 45.926455 -123.983773 Oregon coast, USA. Using the coordinates above, scan north and south of this point to locate the following coastal landforms and phenomena. Bay (Baie) Bay Mouth Bar Beach Breaker Coast Coastal Straightening Dune Estuary Headland Pocket Beach Rip Current Sea Cliff Sea Stack Spit Surf Tide-Dominated Delta Tombolo Wave Refraction Mark each landform or phenomenon you find with the ‘Placemark’ tool and label it. Save several images from Google Earth showing these landforms. Additional questions: a. What is the dominant wave direction in the images you examined? b. What is the dominant longshore drift direction in the images you examined? c. What evidence did you use to identify potential rip currents in these images? d. What do you think are the sources of sand along these beaches? e. Where is the beach the widest in these images? f. Is there evidence of human-induced coastal change along this coast? Briefly describe the evidence for human impacts on this coast. COASTAL LANDFORMS AND PHENOMENA OF SANDY COASTS Coastal processes are among the most dynamic geologic processes; change in the morphology of many coasts can be observed on annual (or shorter) time scales. The ever-pounding waves generated by winds at sea release tremendous quantities of energy along continental margins, constantly shaping coasts. In this exercise, you will identify a number of commonly observed coastal landforms and phenomena of sandy shores. Fig. 1. Google Earth image of Oregon Inlet on the North Carolina Outer Banks. In Google Earth, enter the coordinates below into the query bar: 35.773957 35.225622 -75.532792 -75.551944 Oregon Inlet, North Carolina, USA Cape Hatteras, North Carolina, USA. Using the coordinates above, scan north and south of this point to locate the following coastal landforms and phenomena. Barrier Island Beach Breaker Beach Ridges Cape Coastal Plain Cuspate Foreland Dune Ebb Tide Delta Estuary Flood Tide Delta Inlet Overwash Fan Recurved Spit Rip Current Salt Marsh Surf Tidal Channel Tidal Creeks Wave Refraction Mark each landform or phenomenon you find with the ‘Placemark’ tool and label it. Save several images from Google Earth showing these landforms. Additional questions: g. What is the dominant wave direction in the images you examined? h. What is the dominant longshore drift direction in the images you examined? i. What evidence did you use to identify potential drift directions in these images? j. What do you think are the sources of sand along these beaches? k. Where is the beach the widest in these images? l. Is there evidence of human-induced coastal change along this coast? Briefly describe the evidence for human impacts on this coast. 2. DESERTS AND WIND ACTION GEOMORPHOLOGY OF ARID LANDSCAPES Arid lands are those where annual evaporation exceeds precipitation. Worldwide, deserts occupy significant areas of the middle latitudes, owing in part to the general circulation of the atmosphere. In this exercise, you will identify a number of landforms associated with deserts. Fig. 1. Google Earth image of desert south of Death Valley National Park, California, USA. In Google Earth, enter the coordinates below into the query bar: 36.112680 -116.774381 Death Valley National Park, USA. Using the coordinates above, scan north and south of this point to locate the following desert landforms and phenomena. Mark each landform you find with the ‘Placemark’ tool and label it. Save several images from Google Earth showing these landforms. The list of coordinates below will take you to various parts of the world to see examples of different types of sand dunes. Examine each image and identify the type(s) of dunes present and the wind dominant direction(s). LATITUDE LONGITUDE EYE ALTI (km) TYPE 32.911034 -115.045006 3 29.518642 5.393480 40 27.312686 7.795855 52 27.224491 8.644204 15 29.958540 -3.285948 13 28.56630 41.222551 10 21.699600 54.930310 25 14.064931 47.813351 10 -24.257854 15.094621 10 -24.234498 14.657788 4.00 -20.551653 -70.05628 1.5 WIND DIRECTIONS(S) 3. GEOLOGIC STRUCTURES FAULTS AND FAULTING Tectonism is ubiquitous on Earth, the fundamental process responsible for the terrains we find familiar. In this exercise, you will visit a series of locations where distinctive geologic structures are exposed by geologic processes. Your task will be to identify these structures as best you can. Fig. 1. Google Earth image of Great Glen Fault, Scotland. Can you determine the sense of offset? In Google Earth, use the coordinates below to locate a variety of faults. Inspect each fault and try to determine the sense of offset. Note: In some instances, it may be helpful to increase the vertical exaggeration of the images. This can be changed in Google Earth by accessing ‘Tools’ from the main menu bar. Under the ‘Options’ function you will see ‘Elevation Exaggeration:’ in the lower left of the dialogue box. You can change the vertical exaggeration of the terrain model in Google Earth by typing 1, 2, or 3 (3 is the greatest vertical exaggeration, 1 is the least). The list of coordinates below will take you to various parts of the world to see examples of different types of geologic structures (faults). Examine each image and identify the type(s) of structure illustrated. LATITUDE LONGITUDE EYE ALTI FAULT TYPE FAULT FAULT DIP (km) 44.969228 -108.414814 10 35.528348 -117.336538 2 38.734632 -109.507026 3.5 35.442394 -117.686327 4 36.601581 -114.551509 1 36.453616 -114.483167 4 39.426819 -113.366425 20 36.500986 -111.714474 6 57.034394 -4.796493 190 41.955153 0.845450 4 40.774071 32.047001 54 19.563824 41.577638 9 STRIKE (°) (°) HOW TO MEASURE STRIKE AND DIP? Enable the ‘Measure’ tool in Google Earth (ctrl + 6 keys). Set the ‘Distance’ option to meters. Move the cursor to the upper edge of an exposed stratum and click to start the measure tool. Note the elevation of this first point. Now move the cursor slightly down or up dip on the same stratum. Remember, dip is always measured perpendicular to strike, so take care to move your cursor the correct way! When you have moved a short distance, click the ‘Measure’ tool again. Note both the distance you moved and the elevation of the second point. You should now have two elevations (those of the first and second point on your profile) and the distance separating these two points. To calculate the dip of this stratum, determine the difference in elevation between your two points. Divide this difference by the distance separating the two points. This number should be less than 1. This ratio is the tangent (tan) of the dip angle. To determine this angle, use a calculator to find the arctangent (commonly the INV key followed by TAN key on scientific calculators). 4. GLACIERS AND GLACIATION LANDSCAPES OF ALPINE GLACIATION Episodically throughout Earth’s history, great sheets of ice covered large areas of the continents and mountainous regions of Earth. Glaciers are powerful forces of erosion and deposition on Earth’s surface. In this exercise, you will use Google Earth to identify features associated with alpine glaciers. Fig. 1. Google Earth image of alpine glaciers in southeastern Alaska, USA. In Google Earth, enter the coordinates below into the query bar: 59.411909 -138.311455 Southeast Alaska, USA. Using the coordinates above, scan north and south of this point to locate the following glacial landforms and phenomena. Alpine Glacier Arete Bergschrund Braided Stream Cirque Col Crevasse Erratic Boulder Equilibrium Line Glacial Stream Lines Hanging Valley Headwall Horn Ice Field Kettle Lateral Moraine Medial Moraine Outwash Fan Outwash Plain Proglacial Lake Receding Glacier Rock Flour Terminal Moraine Terminus Truncated Spur U-Shaped Valley Zone of Ablation Zone of Accumulation 5. RIVER GEOMORPHOLOGY FLUVIAL GEOMORPHOLOGY Images of rivers are plentiful in Google Earth. In this exercise, you will identify a number of fluvial landforms. Fig. 1. Google Earth image of the Red River bordering Texas and Oklahoma, USA. To acquire the image above, go to the following coordinates: 33.657612 -94.55.3215 Zoom out until your view is at an altitude of 10.00 km. This is an image of the Red River, forming the boundary between the states of Texas and Oklahoma in the United States. Use this image to identify the fluvial features listed in the table below. Bar Bed Load Flood Plain Lateral Erosion Meander Meander Scar Meander Cut-off Oxbow Lake Point Bar Point Bar Sequence Stream Channel Cut-bank MOUNTAIN WIDTH AND VALLEY SPACING In this exercise you will assess the valley spacing for different mountain ranges. This is an image of the Eastern rift valley of Taiwan showing river outlets. 1. Open an excel spread sheet and determine the spacing S between river outlets for these different mountain belts and the mountain width W (distance between river outlet and main divide): (One per group) 1. East Rift valley Taiwan ( 23°18'17.30"N 121°19'23.40"E) 2. West Coast South New Zealand (43°43'36.17"S 169°18'25.96"E) 3. East Coast Baffin Island (70°45'35.80"N 70°46'21.89"W) 4. North Eastern Tien Shan (43° 3'11.41"N 83°19'39.20"E) 5. Fold of South Tien Shan (41°39'17.86"N 82°19'11.61"E) 6. Eastern Alps Italia ( 44°39'54.10"N 7°18'32.13"E) 7. Fold of Zagros Iran ( 27°37'49.14"N 52°53'5.97"E) 8. Western Coast of the Andes (19° 2'41.14"S 70°14'11.87"W) 2. Compute the ratio between the two R= W/S and assess the uncertainty 3. Compare between the different groups. Explain the results. VALLEY ORIENTATION AND TECTONICS In this exercise you will assess the orientation of the different valley on the south-eastern part of the south island of New Zeala nd. Open an excel spread sheet and note for each main catchment its average coordinates and its principal orientation Discuss the results in the context of tectonics activity in New Zealand. 6. LANDSLIDES LANDSLIDES GEOMETRIES For this exercise, you will determine the geometry of several landslides and then estimate the resistance coefficient of sliding. The parameters defining the geometry of landslides includes, the landslide height H (the difference of altitude between the source and the deposit), the landslide runout L (the horizontal distance between the source and the deposit). In some case the lateral extent of the landslide source and deposits might be a useful information too. Open an excel spreadsheet Determine the parameters L and H, and the associated uncertainty, for several landslides: Hattian landslide – Pakistan (34° 8'20.22"N 73°43'38.91"E) Tsergo Ri landslide – Nepal (28°12'43.15"N 85°36'0.32"E) Eureka Valley landslide – USA (37° 4'31.73"N 117°39'4.77"W) Quiraing landslide – Scotland (57°38'3.47"N 6°15'57.56"W) Estimate the resistance factor R for these different landslides. Remember that the energy lost by friction is Er = M g L R 7. ANTHROPOGENIC GEOMORPHOLOGY THE BINGHAM CANYON COPPER MINE, UTAH, USA For this exercise, you will use Google Earth and Microsoft Excel to calculate the quantity of rock removed from the Bingham Copper Pit, one of the world’s largest open-pit mines. In addition, you will be able to estimate the percentage of copper ore disseminated in these rocks and the quantity of rock that must be removed for each ton of copper produced. To locate the Bingham Copper Pit, enter the following coordinates into the query bar of Google Earth: 40.520978, -112.150242 (don’t forget the negative sign in front of the longitude coordinate!) Fig. 1. Google Earth image of the Bingham Canyon copper mine (“Bingham Pit”), Utah, USA. Congratulations! You have landed at the bottom of the Bingham Copper Pit southwest of Salt Lake City, Utah, USA! Move your cursor around in the bottom of the main pit to locate the minimum elevation and write it down in your notes. Answer the following questions to help you determine the volume and mass of rock removed from this pit: a. What is the maximum elevation (meters) of the pit rim? b. What is the minimum elevation (meters) in the bottom of the pit? c. What is the depth of the main pit (meters)? d. What is the radius of the main pit (meters)? e. Using the formula for the volume of a cone (V=1/3 pi r² h) and the density of the rock (2.8 g/cm3), what is the volume and mass of rock removed from this pit (m³ and kg)? f. Since mining began in 1904, 15.4 million tons of copper have been smelted from this mine. What percentage of the total rock mass mined from the pit was copper? How many tons of rock must be mined to yield one ton of copper? 8. PLANETARY GEOLOGY GEOMORPHOLOGY OF IMPACT CRATERS Among the most conspicuous, abundant, and widespread phenomena in the early Solar System was cratering of planetary surfaces as the new planets were bombarded with remnant planetesimals, asteroids, and other rocky and cometary debris scattered throughout the system. Fig. 1. Google Earth image of Manicouagan Crater, Quebec, Canada. Earth was not immune from these impacts, though much of the geologic record of these events was long ago recycled on our geologically active planet. Google Earth will take you to a number of the best-known, most thoroughly documented impact sites on our home planet. Just enter the coordinates below into the query bar of Google Earth and you will be transported to the locations of great catastrophes in Earth’s history. Name Location Diameter Age (years) coordinates NAME LOCATION DIAMETER AGE (YRS) LAT Aorounga Chad 12.6 km <345,000,000 19.10 19.25 Tin Bider Algeria 6 km <70,000,000 27.60 5.12 Roter Kamm Namibia 2.5 km 3,700,000 -27.77 16.30 Oasis Libya 18 km <120,000,000 24.58 24.40 Clearwater E Quebec 26 km 290,000,000 56.05 -74.11 Clearwater W Quebec 36 km 290,000,000 56.21 -74.51 New Quebec Quebec 3.44 km 1,400,000 61.27 -73.66 Gow Saskatchewan 5 km < 250 million 56.46 -104.48 Deep Bay Saskatchewan 13 km 99 ± 4 million 56.40 -102.99 Barringer Arizona 1.186 km 49,000 -111.02 35.02 LON Now use a excel spread sheet to compute the velocity of the impactor for the previous impact craters assuming: - that the impactor diameter is either equal to the crater diameter or two times smaller - that the angle of impact is either 45° You can use this empirical formula: Dtc= 1.161 (ρi/ρt)¹/³ L⁰ .⁷ ⁸ vi0.44 g–0.22 sin1/3θ This equation relates the crater outer rim diameter Dtc (m) to the density of the target ρt and impactor ρi (kg.m−3), the impactor diameter after atmospheric entry L (m), the impact velocity at the surface vi (m.s−1), the angle of impact θ, and the Earth’s surface gravity g (m.s−2). 9. VOLCANOES AND VOLCANIC ACTIVITY GEOMORPHOLOGY OF VOLCANOES In this exercise, you will compare the geomorphology of composite volcanoes (stratovolcanoes) and shield volcanoes using Google Earth. Fig. 1. Google Earth image of Mount Fuji, Japan. In order to compare some geomorphic attributes of composite and shield volcanoes, it will be necessary to construct topographic profiles across a number of examples worldwide. To do this, you will use the ‘Measure’ tool in Google Earth and enter data into a Microsoft Excel spreadsheet. To construct a topographic profile, begin by enabling the metric measures in Google Earth. This is accomplished by clicking on ‘Tools’ on the menu bar at the top of the page, then clicking on ‘Options’. When the ‘Options’ dialogue opens, you will see in the lower left of the dialogue an ‘Elevation’ option. Choose Meters, Kilometers, then ‘Apply Settings’. Next, you should start up the Microsoft Excel program as you will be entering data generated from Google Earth into this spreadsheet. When the spreadsheet opens, label one column ‘Distance (m)’ and one column ‘Elevation (m)’. Now, return to the Google Earth window and enable the ‘Measure’ tool by clicking on the word ‘Measure’ (or simultaneously using ‘ctrl + 6’ keys on your keyboard). When the ‘Measure’ dialogue box appears, use the drop down window to choose meters as the units of distance. Also select the tab labeled ‘Path’. Note that the ‘Measure’ icon on your image appears as a box with tick marks along the mid-points. This box can be used to add points along your profile with approximately equal spacing; simply click the first point, then move the box until one of its tick marks is aligned with this point; now click again. The next point is located approximately the distance from the center of the box to a tick mark. This distance varies depending on the level to which you are zoomed into the image. In addition, from point to point, the distance is not precisely the same, but it is close enough for the exercises we are attempting to conduct. If you add a point and want to delete it, simply right click on your mouse and it will disappear. You can determine the approximate spacing to each point by noting the cumulative distance along your profile and entering this distance at each point into the spreadsheet. To begin your topographic profile, go to the first entry in the table below and enter the coordinates of the volcano in the Google Earth query bar. When Google Earth relocates to this position, zoom out until you can see the entire volcanic edifice. Select a point along one edge of the volcanic edifice as your starting point and click on the ‘Measure’ tool. Note the distance reads ‘0.00’ meters. Type this value into the ‘Distance’ column of your spreadsheet. Note the elevation of this point by placing the ‘Measure’ cursor over it. A pointing finger icon will appear and you will be able to read the elevation (“elev”) of the point along the bottom of the image window to the right of the longitude. Increment to your next point along your traverse by moving the ‘Measure’ cursor approximately by the half-width of the cursor box, then click again. This is your second profile point. When you click this point, note the distance along your profile (read from the ‘Measure’ dialogue box) and the elevation of the point (read along the bottom of the image to the right of the longitude). Enter the distance and the elevation into their respective columns in your spreadsheet. Repeat this process until you have completed a traverse across the volcanic edifice displayed on Google Earth. To plot this topographic profile in Excel, choose the ‘Chart’ function from the ‘Insert’ menu at the top of the screen. For ‘Chart Type’, choose, ‘XY (Scatter)’. Choose the scatter plot option ‘Scatter with data points connected by lines’. Make the ‘DISTANCE’ column the X-axis and ‘ELEVATION’ column the YAxis of your plot. To add a second topographic profile to the first from the ‘Chart’ dialogue box, click on the ‘Series’ tab at the top of the box. In the ‘Series’ box in the lower left corner, click on the ‘Add’ button. Type ‘Mount Fuji’ in the ‘Name’ box to the right, then for ‘X values’ add the data from the ‘DISTANCE’ column from Mt. Fuji; ‘Y values’ will be the ‘ELEVATION’ data from Mt. Fuji. Describe what you observe on the resulting topographic profile for these volcanoes. Note that both profiles are nearly triangular above 1000 m elevation. Given that each volcano is nearly circular, each is actually cone-shaped. Use the Internet to locate the formula for the volume of a cone. Once you have located the formula for the volume of a cone, calculate the volumes of Mauna Kea and Mt. Fuji above from the 1,000 m elevation to each volcano’s summit. How do these volcanoes compare? Table 1. Location of shield volcano and composite volcano for this exercise. NAME LATITUDE LONGITUDE Mauna Kea, Hawai’i 19.815332 -155.472645 Mount Fuji, Japan 35.366673 138.733347 IDENTIFYING VOLCANIC LANDFORMS Volcanoes are important features of Earth’s surface geology. For this exercise, you will visit a number of localities around the world where volcanic landforms can be observed. Your task will be to identify the different volcanic landforms in the table below. Fig. 1. Google Earth image of SP Crater, northern Arizona, USA. Enter the geographic coordinates for each feature below in the query bar of Google Earth. Once the feature has been located, zoom in or out to the indicated altitude, then identify the volcanic feature centered in the image. Remember, (+) values are north latitude and east longitude; (-) values are south latitude and west longitude. Composite Volcano Shield Volcano Cinder Cone Caldera Lahar Pyroclastic Flow Lava Dome Lava Flows Volcanic Crater A LATITUDE (deg) LONGITUDE (deg) ALTITUDE (km) 35.366673 138.733347 20.0 LANDFORM B 19.540564 -155.534218 170.0 C 13.551444 40.744028 12.0 D 35.558949 -11.605573 5.75 E 14.916362 -24.375447 28.5 F -0.378905 -91.514776 32 G 50.855056 155.558648 18 H 46.199442 -122.188722 5.0 I 46.248469 -122.166488 6.5 J 42.93680 -122.104928 18.2 K 41.587152 -122.474640 14.8 L 56.569979 158.579963 7.9 M 41.396334 -122.19003 19.0 N -3.064728 37.358316 11.9 O 14.986742 120.222811 14 P 13.254101 123.685199 15 Q 2.425559 98.842043 68.5 R -7.951140 112.951327 13.2 ADDITIONAL QUESTIONS: 1. What type of volcanic rocks would you expect to be erupted from ‘B’ above? 2. Of what type volcanic rock do you think the feature in ‘H’ is composed? 3. Use the ‘Measure’ tool to estimate the diameter of the feature in ‘J’. What is the diameter of this feature? 4. The feature in ‘J’ is approximately circular. What is its area? 5. Use the ‘Measure’ tool in Google Earth to determine the distance from the feature in ‘K’ and the summit of its parent volcano. How far is it? 6. Use the ‘Measure’ tool in Google Earth to determine the distance from the feature in ‘O’ and the summit of its parent volcano. How far is it? 7. Use the ‘Measure’ tool to determine the length and width of the feature in ‘Q’. VOLCANIC ISLANDS AND ATOLLS Among his many contributions to our understanding of the natural world, Charles Darwin hypothesized on the formation of atolls across the Pacific Ocean. For this exercise, you will have an opportunity to experience observations like those made by Darwin during his time aboard HMS Beagle. Fig. 1. Google Earth image of Bikini Atoll, Republic of the Marshall Islands Based on his observations of Pacific island archipelagos during his cruise on HMS Beagle in the first half of the 1800, Darwin hypothesized that atolls represented the final stage in the cycle of volcanic islands. For this assignment, you should attempt to locate a series of images from various places across the Pacific Ocean to illustrate Darwin’s Atoll Hypothesis—Darwin’s idea was confirmed by the Royal Society Coral Reef Expedition of 1896-1898, during which the island of Funafuti was drilled to reveal coral overlying volcanic rocks. Fig. 2. Darwin’s hypothesis for atoll formation (From “Structure and Distribution of Coral Reefs”, 1842). To begin the assignment, start Google Earth and go to the Pacific Ocean. Search the images of Pacific islands until you find a compete series showing a) high volcanic island with little or no reef development, b) high volcanic island with fringing reefs, c) eroded volcanic island with barrier reef and developing lagoon, d) atoll.


