2 Coefficient of Restitution 1 Introduction 4 Collision Model 3
advertisement
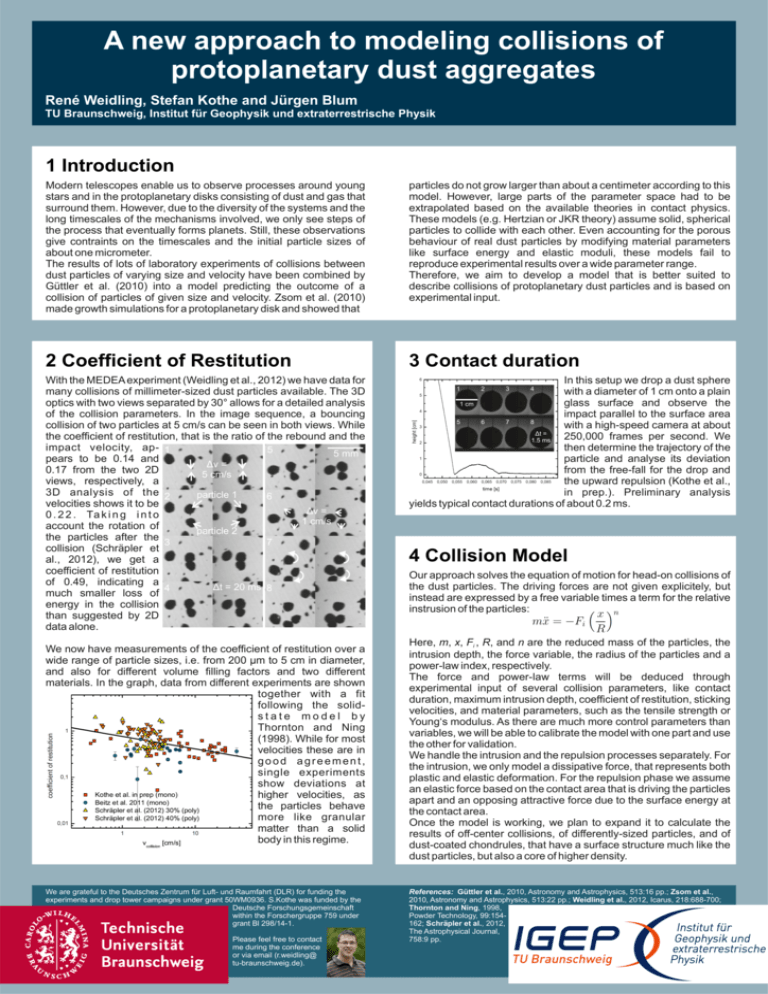
A new approach to modeling collisions of protoplanetary dust aggregates René Weidling, Stefan Kothe and Jürgen Blum TU Braunschweig, Institut für Geophysik und extraterrestrische Physik 1 Introduction Modern telescopes enable us to observe processes around young stars and in the protoplanetary disks consisting of dust and gas that surround them. However, due to the diversity of the systems and the long timescales of the mechanisms involved, we only see steps of the process that eventually forms planets. Still, these observations give contraints on the timescales and the initial particle sizes of about one micrometer. The results of lots of laboratory experiments of collisions between dust particles of varying size and velocity have been combined by Güttler et al. (2010) into a model predicting the outcome of a collision of particles of given size and velocity. Zsom et al. (2010) made growth simulations for a protoplanetary disk and showed that particles do not grow larger than about a centimeter according to this model. However, large parts of the parameter space had to be extrapolated based on the available theories in contact physics. These models (e.g. Hertzian or JKR theory) assume solid, spherical particles to collide with each other. Even accounting for the porous behaviour of real dust particles by modifying material parameters like surface energy and elastic moduli, these models fail to reproduce experimental results over a wide parameter range. Therefore, we aim to develop a model that is better suited to describe collisions of protoplanetary dust particles and is based on experimental input. 2 Coefficient of Restitution 3 Contact duration With the MEDEA experiment (Weidling et al., 2012) we have data for many collisions of millimeter-sized dust particles available. The 3D optics with two views separated by 30° allows for a detailed analysis of the collision parameters. In the image sequence, a bouncing collision of two particles at 5 cm/s can be seen in both views. While the coefficient of restitution, that is the ratio of the rebound and the impact velocity, ap- 1 5 5 mm pears to be 0.14 and Δv = 0.17 from the two 2D 5 cm/s views, respectively, a 3D analysis of the 2 particle 1 6 velocities shows it to be Δv = 0 . 2 2 . Ta k i n g i n t o 1 cm/s account the rotation of particle 2 the particles after the 3 7 collision (Schräpler et al., 2012), we get a coefficient of restitution of 0.49, indicating a Δt = 20 ms 8 4 much smaller loss of energy in the collision than suggested by 2D data alone. In this setup we drop a dust sphere 1 2 3 4 with a diameter of 1 cm onto a plain glass surface and observe the 1 cm impact parallel to the surface area 5 7 8 6 with a high-speed camera at about Δt = 250,000 frames per second. We 1.5 ms then determine the trajectory of the particle and analyse its deviation from the free-fall for the drop and the upward repulsion (Kothe et al., in prep.). Preliminary analysis yields typical contact durations of about 0.2 ms. We now have measurements of the coefficient of restitution over a wide range of particle sizes, i.e. from 200 µm to 5 cm in diameter, and also for different volume filling factors and two different materials. In the graph, data from different experiments are shown together with a fit following the solidstate model by Thornton and Ning (1998). While for most velocities these are in good agreement, single experiments show deviations at higher velocities, as the particles behave more like granular matter than a solid body in this regime. We are grateful to the Deutsches Zentrum für Luft- und Raumfahrt (DLR) for funding the experiments and drop tower campaigns under grant 50WM0936. S.Kothe was funded by the Deutsche Forschungsgemeinschaft within the Forschergruppe 759 under grant Bl 298/14-1. Please feel free to contact me during the conference or via email (r.weidling@ tu-braunschweig.de). 4 Collision Model Our approach solves the equation of motion for head-on collisions of the dust particles. The driving forces are not given explicitely, but instead are expressed by a free variable times a term for the relative instrusion of the particles: Here, m, x, Fi , R, and n are the reduced mass of the particles, the intrusion depth, the force variable, the radius of the particles and a power-law index, respectively. The force and power-law terms will be deduced through experimental input of several collision parameters, like contact duration, maximum intrusion depth, coefficient of restitution, sticking velocities, and material parameters, such as the tensile strength or Young‘s modulus. As there are much more control parameters than variables, we will be able to calibrate the model with one part and use the other for validation. We handle the intrusion and the repulsion processes separately. For the intrusion, we only model a dissipative force, that represents both plastic and elastic deformation. For the repulsion phase we assume an elastic force based on the contact area that is driving the particles apart and an opposing attractive force due to the surface energy at the contact area. Once the model is working, we plan to expand it to calculate the results of off-center collisions, of differently-sized particles, and of dust-coated chondrules, that have a surface structure much like the dust particles, but also a core of higher density. References: Güttler et al., 2010, Astronomy and Astrophysics, 513:16 pp.; Zsom et al., 2010, Astronomy and Astrophysics, 513:22 pp.; Weidling et al., 2012, Icarus, 218:688-700; Thornton and Ning, 1998, Powder Technology, 99:154162; Schräpler et al., 2012, The Astrophysical Journal, 758:9 pp.
