Atomic Spectroscopy
advertisement
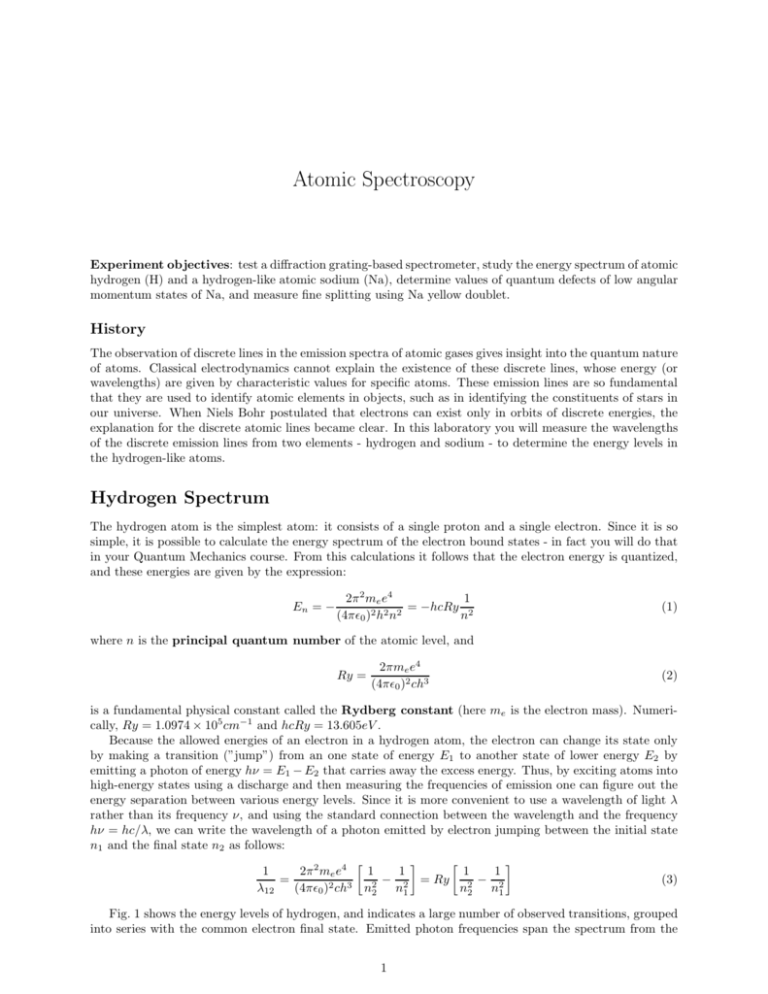
Atomic Spectroscopy Experiment objectives: test a diffraction grating-based spectrometer, study the energy spectrum of atomic hydrogen (H) and a hydrogen-like atomic sodium (Na), determine values of quantum defects of low angular momentum states of Na, and measure fine splitting using Na yellow doublet. History The observation of discrete lines in the emission spectra of atomic gases gives insight into the quantum nature of atoms. Classical electrodynamics cannot explain the existence of these discrete lines, whose energy (or wavelengths) are given by characteristic values for specific atoms. These emission lines are so fundamental that they are used to identify atomic elements in objects, such as in identifying the constituents of stars in our universe. When Niels Bohr postulated that electrons can exist only in orbits of discrete energies, the explanation for the discrete atomic lines became clear. In this laboratory you will measure the wavelengths of the discrete emission lines from two elements - hydrogen and sodium - to determine the energy levels in the hydrogen-like atoms. Hydrogen Spectrum The hydrogen atom is the simplest atom: it consists of a single proton and a single electron. Since it is so simple, it is possible to calculate the energy spectrum of the electron bound states - in fact you will do that in your Quantum Mechanics course. From this calculations it follows that the electron energy is quantized, and these energies are given by the expression: En = − 2π 2 me e4 1 = −hcRy 2 (4πǫ0 )2 h2 n2 n (1) where n is the principal quantum number of the atomic level, and Ry = 2πme e4 (4πǫ0 )2 ch3 (2) is a fundamental physical constant called the Rydberg constant (here me is the electron mass). Numerically, Ry = 1.0974 × 105 cm−1 and hcRy = 13.605eV . Because the allowed energies of an electron in a hydrogen atom, the electron can change its state only by making a transition (”jump”) from an one state of energy E1 to another state of lower energy E2 by emitting a photon of energy hν = E1 − E2 that carries away the excess energy. Thus, by exciting atoms into high-energy states using a discharge and then measuring the frequencies of emission one can figure out the energy separation between various energy levels. Since it is more convenient to use a wavelength of light λ rather than its frequency ν, and using the standard connection between the wavelength and the frequency hν = hc/λ, we can write the wavelength of a photon emitted by electron jumping between the initial state n1 and the final state n2 as follows: 1 2π 2 me e4 1 1 1 1 = − 2 = Ry 2 − 2 (3) λ12 (4πǫ0 )2 ch3 n22 n1 n2 n1 Fig. 1 shows the energy levels of hydrogen, and indicates a large number of observed transitions, grouped into series with the common electron final state. Emitted photon frequencies span the spectrum from the 1 Figure 1: Spectrum of Hydrogen. The numbers on the left show the energies of the hydrogen levels with different principle quantum numbers n in eV . The wavelength of emitted photon in Å are shown next to each electron transition. UV (UltraViolet) to the IR (InfraRed). Among all the series only the Balmer series, corresponding to n2 = 2, has its transitions in visible part of the spectrum. Moreover, from all the possible transition, we will be able to to observe and measure only the following four lines: n1 = 6 → 2, 5 → 2, 4 → 2, and 3 → 2. Sodium spectrum Sodium (Na) belongs to the chemical group of alkali metals [together with lithium (Li), potassium (K), rubidium (Rb), cesium (Cs) and Francium (Fr)]. All these elements consist of a closed electron shell with one extra unbound electron. Not surprisingly, the energy level structure for this free electron is very similar to that of hydrogen. For example, a Na atom has 11 electrons, and its electronic configuration is 1s2 2s2 2p6 3s. Ten closed-shell electrons effectively screen the nuclear charge number (Z = 11) to an effective charge Z ∗ ≈ 1, so that the 3s valent electron experiences the electric field potential similar to that of a hydrogen atom, given by the Eq. 1. However, there is an important variation of the energy spectrum of alkali metals, related to the electron angular momentum l. In hydrogen the energy levels with same principle quantum number n but different electron angular momentum l = 0, 1, · · · (n − 1) are degenerate. For Na and others the levels with different values of l are shifted with respect to each other. This is mainly due to the interaction of the unpaired electrons with the electrons of the closed shells. For example, the orbits of the electron with large angular 2 momentum value l is far above closed shell, and thus their energies are basically the same as for the hydrogen atom. An electron with smaller l spends more time closer to the nuclear, and “feels” stronger bounding electrostatic potential. As a result the corresponding energy levels are pulled down compare to those of hydrogen, and the states with the same principle number n but different angular momenta l are split (i.e. have different energies). To take onto account the modification of the atomic spectra while still using the same basic equations as for the hydrogen, it is convenient to introduce a small correction ∆l to the principle quantum number n to take into account the level shifts. This correction is often called a quantum defect, and its value depends on the angular momentum l, and does not vary much between states with different principle quantum numbers n but same l1 : hcRy Enl = − (4) (n − ∆l )2 In particular, the energies of two states with the lowest angular momentum (s and p) are noticeably affected by the more complicated electron structure of Na, while the energy levels of the states with the higher values of angular momentum (d, f ) are identical to the hydrogen energy spectrum. The spectrum of Na is shown in Fig. 2. One can immediately see that there are many more optical transitions because of the lifted degeneracy of energy states with different angular momenta. However, not all electronic transition are allowed: since the angular momentum of a photon is 1, then the electron angular momentum cannot change by more than one while emitting one spontaneous photon. Thus, it is important to remember the following selection rule for atomic transitions: ∆l = ±1. (5) According to that rule, only transitions between two “adjacent” series are possible: for example p → s or d → p are allowed, while s → s or s → d are forbidden. The strongest allowed optical transitions are shown in Fig. 3. Note that each level for given n and l is split into two because of the fine structure splitting. This splitting is due to the effect of electron spin and its coupling with the angular momentum. Proper treatment of spin requires knowledge of quantum electrodynamics and solving Dirac equation; for now spin can be treated as an additional quantum number associated with any particle. The spin of electron is 1/2, and it may be oriented either along or against the non-zero electron’s angular momentum. Because of the weak coupling between the angular momentum and spin, these two possible orientation results in small difference in energy for corresponding electron states. Experimental setup Equipment needed: Gaertner-Peck optical spectrometer, hydrogen discharge lamp, sodium discharge lamp. Fig. 4 gives a top view of the Gaertner-Peck optical spectrometer used in this lab. The spectrometer consists of two tubes. One tube holds a vertical collimator slit of variable width, and should be directed toward a discharge lamp. The light from the discharge lamp passes through the collimator slit and then get dispersed on the diffraction grating mounted in the mounting pedestal in the middle of the apparatus. The other tube holds the telescope that allows you to magnify the image of the collimator slit to get more accurate reading on the rotating table. This tube can be rotated around the central point, so that you will be able to align and measure the wavelength of all visible spectral lines of the lamp in all orders of diffraction grating. It is likely that you will find a spectrometer at nearly aligned condition at the beginning on the lab. Nevertheless, take time making sure that all elements are in order to insure good quality of your data. 1 The accepted notation for different electron angular momentum states is historical, and originates from the days when the proper quantum mechanical description for atomic spectra has not been developed yet. Back then spectroscopists had categorized atomic spectral lines corresponding to their appearend: for example any spectral lines from electron transitions from s-orbital (l = 0) appeared always Sharp on a photographic film, while those with initial electron states of d-orbital ( l = 2) appeared always Diffuse. Also spectral lines of Principle series (initial state is p-orbital, l = 1) reproduced the hydrogen spectrum most accurately (even though at shifted frequencies), while the Fundamental (initial electron state is f -orbital, l = 3) series matched the absolute energies of the hydrogen most precisely. The orbitals with higher value of the angular momentum are denoted in an alphabetic order (g, h, etc.) 3 Figure 2: Energy spectrum of Na. The energy states of H are shown in far right for comparison. 4 Figure 3: Transitions for Na. The wavelengths of selected transition are shown in Å. Note, that p state is now shown in two columns, one referred to as P1/2 and the other as P3/2 . The small difference between their energy levels is the “fine structure”. 5 Figure 4: Gaertner-Peck Spectrometer Telescope Alignment: Start by adjusting the telescope eyepiece in or out to bring the crosshairs into sharp focus. Next aim the telescope out the window to view a distant object such as leaves in a tree. If the distant object is not in focus, you will have to adjust the position of the telescope tube - ask your instructor for directions. Collimator Conditions: Swing the telescope to view the collimator which is accepting light from the hydrogen discharge tube through a vertical slit of variable width. The slit opening should be set to about 5-10 times the crosshair width to permit sufficient light to see the faint violet line and to be able to see the crosshairs. If the bright column of light is not in sharp focus, you should align the position of the telescope tube again (with the help of the instructor). Diffraction Grating Conditions: In this experiment you will be using a diffraction grating that has 600 lines per mm. A brief summary of diffraction grating operation is given in the Appendix of this manual. If the grating is not already in place, put it back to the baseclamp and fix it there. The table plate that holds the grating can be rotated, so try to orient the grating surface to be maximally perpendicular to the collimator axis. However, the accurate measurement of angle does not require the perfect grating alignment. Instead, for each spectral line in each diffraction order you will be measuring the angles in the Left (θl ) and in the Right (θr ), and use both of the measurements to figure out the optical wavelength using the following equation: d mλ = (sin θr + sin θl ), (6) 2 where m is the diffraction order, and d is the distance between the lines in the grating. Then, with the hydrogen tube ON and in place at the collimator slit, swing the rotating telescope slowly through 90 degrees both on the Left & Right sides of the forward direction. You should observe diffraction maxima for most spectral wavelength, λ, in 1st, 2nd, and 3rd order. If these lines seem to climb uphill or drop downhill the grating has to be adjusted in its baseclamp to bring them all to the same elevation. Also, turn on the sodium lamp as soon as you arrive, since it requires 10-15 minutes to warm up and show clear Na spectrum. 6 Experimental studies of Hydrogen Balmer line Swing the rotating telescope slowly and determine which spectral lines from Balmer series you observe. You should be able to see three bright lines - Blue, Green and Red - in the first (m=1) and second (m=2) diffraction orders on both Left & Right sides. In the third order (m=3) only the Blue, & Green lines are visible, and you will not see the Red. One more line of the Balmer series is in the visible range - Violet, but its intensity is much lower than for the other three line. However, you will be able to find it in the first order if you look carefully with the collimator slit open a little wider. After locating all the lines, measure the angles at which each line occurs. The spectrometer reading for each line should be measured at least twice by different lab partners to avoid systematic errors. Don’t forget: for every line you need to measure the both angles to the Right and to the Left! You should be able to determine the angle with accuracy of 1 minute, but you should know how to read angles with high precision in the spectrometer: first use the bottom scale to get the rough angle reading within a half of the degree. Then use the upper scale for more accurate reading in minutes. To get this reading find a tick mark of the upper scale that aligns perfectly with some tick mark of the bottom scale this is your minute reading. Total angle is the sum of two readings. To measure the frequency precisely center the crosshairs on the line as accurately as possible. Choose the width of lines by turning the collimator slit adjustment screw. If the slit is too wide, it is hard to judge the center of the line accurately; if the slit is too narrow, then not enough light is available to see the crosshairs. For Violet the intensity is noticeably less than for the other three lines, so you may not see it. However, even if you find it, a little assistance is usually required in order to locate the crosshairs at this line. We suggest that a low intensity flashlight be aimed toward the Telescope input, and switched ON and OFF repeatedly to reveal the location of the vertical crosshair relative to the faint Violet line. Data analysis for Hydrogen Data Calculate the wavelength λ for each line observed in all orders, calculate the average wavelength value and uncertainty for each line, and then identify the initial and final electron states principle numbers (n1 and n2 ) for each line using Fig. 1. Make a plot of 1/λ vs 1/n21 where n1 = the principal quantum number of the electron’s initial state. Put all λ values you measure above on this plot. You data point should form a straight line. From Equation (3) determine the physical meaning of both slope and intercept, and compare the data from the fit to the expected values for each of them. The slope should be the Rydberg constant for hydrogen, Ry. The intercept is Ry/(n2 )2 . From this, determine the value for the principal quantum number n2 . Compare to the accepted value in the Balmer series. Experimental studies of Sodium Spectrum Switch to Sodium lamp and make sure the lamp warms up for approximately 5-10 minutes before starting the measurements. Double check that you see a sharp spectrum in the spectrometer (adjust the width of the collimator slit if necessary). In the beginning it will be very useful for each lab partner to quickly scan the spectrometer telescope through all first-order lines, and then discuss which line you see corresponds to with transition in Table and Fig. 3. Keep in mind that the color names are symbolic rather than descriptive! After that carefully measure the left and right angles for as many spectral lines in the first order as possible. The spectrometer reading for each line should be measured at least twice by different lab partners to avoid systematic errors. Determine the wavelengths of all measured Na spectral lines using Eq. 6. Compare these measured mean wavelengths to the accepted values given in Fig. 3 and in the table below. Identify at least seven of the lines with a particular transition, e.g. λ = 4494.3Å corresponds to 8d → 3p transition. 7 Color Red Yellow Green Line1 (Å) Line2 (Å) 6154.3 6160.7 5890.0 5895.9 5682.7 5688.2 5149.1 5153.6 4978.6 4982.9 Blue 4748.0 4751.9 4664.9 4668.6 Blue-Violet 4494.3 4497.7 Line1 and Line2 correspond to transitions to two fine-spitted 3p states P1/2 and P3/2 . These two transition frequencies are very close to each other, and to resolve them with the spectrometer the width of the slit should be very narrow. However, you may not be able to see some weaker lines then. In this case you should open the slit wider to let more light in when searching for a line. If you can see a spectral line but cannot resolve the doublet, record the reading for the center of the spectrometer line, and use the average of two wavelengthes given above. Measurements of the fine structure splitting. Once you measured all visible spectral lines, go back to some bright line (yellow should work well), and close the collimator slit such that you can barely see any light going through. In this case you should be able to see the splitting of the line because of the fine structure splitting of states P1/2 and P3/2 . For the Na D doublet the splitting between two lines ∆λ = λ3/2 − λ1/2 . Measure the splitting between two lines in the first and the second order. Which one works better? Discuss this issue in your lab report. Compare to the accepted value: ∆λ = 5.9 Å. Compare this approach to the use of the Fabry-Perot interferometer. Data analysis for Sodium Calculation of a quantum defect for n = 3, p state. Once you identified all of your measured spectral lines, choose only those that correspond to optical transitions from any d to n = 3, p states. Since the energy states of d series follows the hydrogen spectra almost exactly, the wavelength of emitted light λ is given by: or hc hcRy hcRy = End − E3p = − 2 + , λ nd (3 − ∆p )2 (7) Ry Ry 1 = − 2, λ (3 − ∆p )2 nd (8) where nd is the principle number of the initial d state. To verify this expression by plotting 1/λ versus 1/n2d for the nd = 4,5, and 6. From the slope of this curve determine the value of the Rydberg constant Ry. The Ry value of the intercept in this case is (3−∆ 2 , so use it to find the quantum defect ∆p . p) Compare the results of your calculations for the quantum defect with the accepted value ∆p = 0.86. Appendix: Operation of a diffraction grating-based optical spectrometer A diffraction grating is a common optical element, which consists of a pattern with many equidistant slits or grooves. Interference of multiple beams passing through the slits (or reflecting off the grooves) produces sharp intensity maxima in the output intensity distribution, which can be used to separate different spectral components on the incoming light. In this sense the name “diffraction grating” is somewhat misleading, since we are used to talk about diffraction with regard to the modification of light intensity distribution to finite size of a single aperture. To describe the properties of a light wave after passing through the grating, let us first consider the case of 2 identical slits separated by the distance h, as shown in Fig. 5a. We will assume that the size of the slits is 8 (c) 100 (a) N=10 N=5 N=2 80 q h h q I/I ytisnetni evitaleR 0 (b) 60 40 20 0 -1.5 -1.0 -0.5 0.0 l sinq 0.5 1.0 1.5 h/ Figure 5: Intensity Pattern for Fraunhofer Diffraction much smaller than the distance between them, so that the effect of Fraunhofer diffraction on each individual slit is negligible. Then the resulting intensity distribution on the screen is given my familiar Young formula: πh ikh sin θ 2 2 I(θ) = E0 + E0 e = 4I0 cos sin θ , (9) λ where k = 2π/λ, I0 = |E0 |2 , and the angle θ is measured with respect to the normal to the plane containing the slits. An interference on N equidistant slits illuminated by a plane wave (Fig. 5b) produces much sharper maxima. To find light intensity on a screen, the contributions from all N slits must be summarized taking into account their acquired phase difference, so that the optical field intensity distribution becomes: " #2 2 sin N πh ikh sin θ 2ikh sin θ (N −1)ikh sin θ λ sin θ I(θ) = E0 + E0 e + E0 e + · · · + E0 e . (10) = I0 sin πh λ sin θ Here we again neglect the diffraction form each individual slit, assuming that the size of the slit is much smaller than the separation h between the slits. The intensity distributions from a diffraction grating with illuminated N = 2, 5 and 10 slits are shown in Fig. 5c. The tallest (principle) maxima occur when the denominator of Eq.( 10) becomes zero: h sin θ = ±mλ where m = 1, 2, 3, . . . is the diffraction order. The heights of the principle maxima are Imax = N 2 I0 , and their widths are ∆θ = 2λ/(N h). Notice that the more slits are illuminated, the narrower diffraction peaks are, and the better the resolution of the system is: ∆λ ∆θ 1 = ≃ λ θ Nm (11) For that reason in any spectroscopic equipment a light beam is usually expanded to cover the maximum surface of a diffraction grating. Diffraction Grating Equation when the Incident Rays are not Normal Up to now we assumed that the incident optical wavefront is normal to the pane of a grating. Let’s now consider more general case when the angle of incidence θi of the incoming wave is different from the normal 9 Figure 6: Diagram of the light beams diffracted to the Right (a) and to the Left (b). to the grating, as shown in Fig. 6(a). Rather then calculating the whole intensity distribution, we will determine the positions of principle maxima. The path length difference between two rays 1 and 2 passing through the consequential slits us a + b, where: a = h sin θi ; b = h sin θR (12) Constructive interference occurs for order m when a + b = mλ, or: h sin θi + sin θR = mλ (13) Now consider the case shown in Fig. 6(b). The path length between two beams is now b − a where b = h sin θL . Combining both cases we have: h sin θL − h sin θi h sin θR + h sin θi = = mλ mλ (14) Adding these equations and dividing the result by 2 yields the following expression connecting the Right and Left diffraction angles: h mλ = (sin θL + sin θR ) (15) 2 10

