Allocation
advertisement
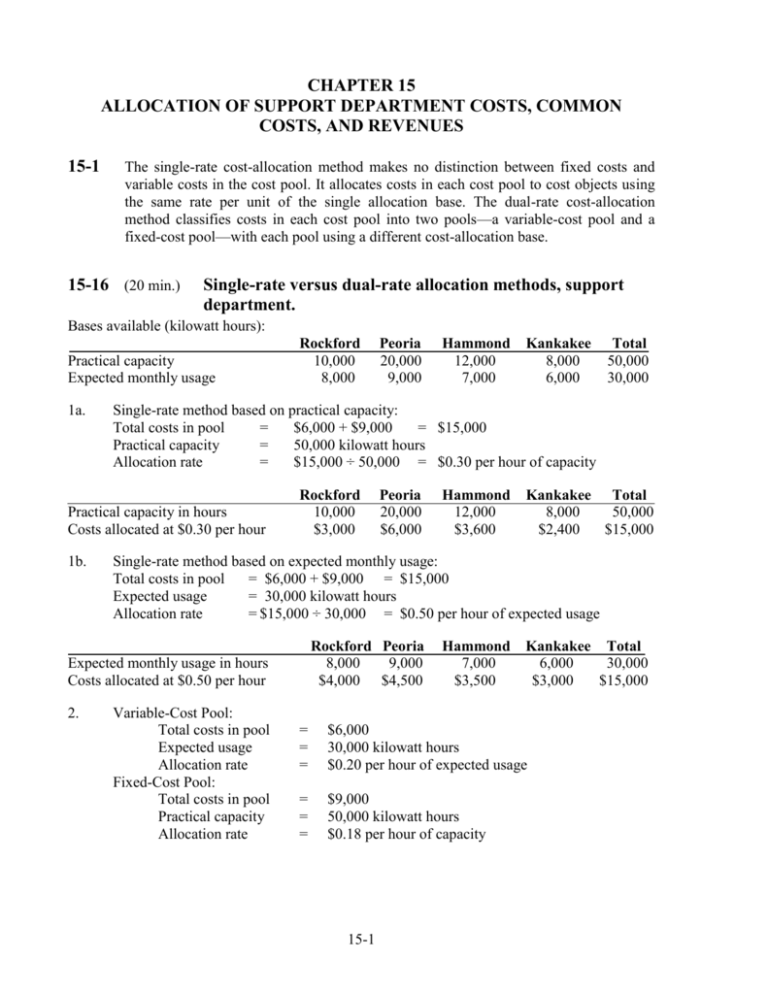
CHAPTER 15 ALLOCATION OF SUPPORT DEPARTMENT COSTS, COMMON COSTS, AND REVENUES 15-1 The single-rate cost-allocation method makes no distinction between fixed costs and variable costs in the cost pool. It allocates costs in each cost pool to cost objects using the same rate per unit of the single allocation base. The dual-rate cost-allocation method classifies costs in each cost pool into two pools—a variable-cost pool and a fixed-cost pool—with each pool using a different cost-allocation base. 15-16 (20 min.) Single-rate versus dual-rate allocation methods, support department. Bases available (kilowatt hours): Practical capacity Expected monthly usage 1a. Rockford 10,000 $3,000 Hammond 12,000 7,000 Kankakee 8,000 6,000 Total 50,000 30,000 Peoria 20,000 $6,000 Hammond 12,000 $3,600 Kankakee Total 8,000 50,000 $2,400 $15,000 Single-rate method based on expected monthly usage: Total costs in pool = $6,000 + $9,000 = $15,000 Expected usage = 30,000 kilowatt hours Allocation rate = $15,000 ÷ 30,000 = $0.50 per hour of expected usage Rockford Peoria 8,000 9,000 $4,000 $4,500 Expected monthly usage in hours Costs allocated at $0.50 per hour 2. Peoria 20,000 9,000 Single-rate method based on practical capacity: Total costs in pool = $6,000 + $9,000 = $15,000 Practical capacity = 50,000 kilowatt hours Allocation rate = $15,000 ÷ 50,000 = $0.30 per hour of capacity Practical capacity in hours Costs allocated at $0.30 per hour 1b. Rockford 10,000 8,000 Variable-Cost Pool: Total costs in pool Expected usage Allocation rate Fixed-Cost Pool: Total costs in pool Practical capacity Allocation rate Hammond 7,000 $3,500 Kankakee Total 6,000 30,000 $3,000 $15,000 = = = $6,000 30,000 kilowatt hours $0.20 per hour of expected usage = = = $9,000 50,000 kilowatt hours $0.18 per hour of capacity 15-1 Variable-cost pool $0.20 × 8,000; 9,000; 7,000, 6,000 Fixed-cost pool $0.18 × 10,000; 20,000; 12,000, 8,000 Total Rockford Peoria Hammond Kankakee Total $1,600 $1,800 $1,400 $1,200 $ 6,000 1,800 $3,400 3,600 $5,400 2,160 $3,560 1,440 $2,640 9,000 $15,000 The dual-rate method permits a more refined allocation of the power department costs; it permits the use of different allocation bases for different cost pools. The fixed costs result from decisions most likely associated with the practical capacity level. The variable costs result from decisions most likely associated with monthly usage. 15-2 15-19 (30 min.) Support department cost allocation, direct and step-down methods. 1. a. Direct Method Costs Alloc. of A/H (40/75, 35/75) Alloc. of I.S. (30/90, 60/90) A/H IS $600,000 $2,400,000 (600,000) (2,400,000) 0 $ 0 $ b. Step-Down (A/H first) Costs Alloc. of A/H (0.25, 0.40, 0.35) Alloc. of I.S. (30/90, 60/90) Step-Down (I.S. first) Costs Alloc. of I.S. (0.10, 0.30, 0.60) Alloc. of A/H (40/75, 35/75) Corp. $ 320,000 $ 280,000 800,000 $1,120,000 1,600,000 $1,880,000 $ 240,000 $ 210,000 850,000 $1,090,000 1,700,000 $1,910,000 $ 720,000 $1,440,000 448,000 $1,168,000 392,000 $1,832,000 Govt. Corp. $1,120,000 1,090,000 1,168,000 $1,880,000 1,910,000 1,832,000 $600,000 $2,400,000 (600,000) $ c. Govt. 0 150,000 (2,550,000) $ 0 $600,000 $2,400,000 240,000 (2,400,000) (840,000) $ 0 $ 2. Direct method Step-Down (A/HR first) Step-Down (I.S. first) 0 The direct method ignores any services to other support departments. The step-down method partially recognizes services to other support departments. The information systems support group (with total budget of $2,400,000) provides 10% of its services to the A/H group. The A/H support group (with total budget of $600,000) provides 25% of its services to the information systems support group. 3. Three criteria that could determine the sequence in the step-down method are: a. Allocate support departments on a ranking of the percentage of their total services provided to other support departments. 1. Administrative/HR 25% 2. Information Systems 10% 15-3 b. Allocate support departments on a ranking of the total dollar amount in the support departments. 1. Information Systems $2,400,000 2. Administrative/HR $ 600,000 c. Allocate support departments on a ranking of the dollar amounts of service provided to other support departments 1. 2. Information Systems (0.10 $2,400,000) Administrative/HR (0.25 $600,000) = $240,000 = $150,000 The a. approach typically better approximates the theoretically preferred reciprocal method. It results in a higher percentage of support-department costs provided to other support departments being incorporated into the step-down process than does b. or c. 15-24 (20 min.) Allocation of common costs. 1. Allocation of the $1,800 airfare: Alternative approaches include: a. The stand-alone cost allocation method. This method would allocate the air fare on the basis of each user’s percentage of the total of the individual stand-alone costs: Baltimore employer $1,400 ($1,400 + $1,100) $1,800 = $1,008 Chicago employer $1,100 ($1,400 + $1,100) $1,800 = 792 $1,800 Advocates of this method often emphasize an equity or fairness rationale. b. The incremental cost allocation method. This requires the choice of a primary party and an incremental party. If the Baltimore employer is the primary party, the allocation would be: Baltimore employer Chicago employer $1,400 400 $1,800 One rationale is Ernst was planning to make the Baltimore trip, and the Chicago stop was added subsequently. Some students have suggested allocating as much as possible to the Baltimore employer since Ernst was not joining them. If the Chicago employer is the primary party, the allocation would be: 15-4 Chicago employer Baltimore employer $1,100 700 $1,800 One rationale is that the Chicago employer is the successful recruiter and presumably receives more benefits from the recruiting expenditures. 2. Ernst should use the stand-alone allocation method because it treats both employers the same rather than one employer as the primary party and the other employer as the incremental party. Alternatively, Ernst could calculate the Shapley value that considers each employer in turn as the primary party: The Baltimore employer is allocated $1,400 as the primary party and $700 as the incremental party for an average of ($1,400 + $700) ÷ 2 = $1,050. The Chicago employer is allocated $1,100 as the primary party and $400 as the incremental party for an average of ($1,100 + 400) ÷ 2 = $750. The Shapley value approach would allocate $1,050 to the Baltimore employer and $750 to the Chicago employer. 3. A simple approach is to split the $60 equally between the two employers. The limousine costs at the Sacramento end are not a function of distance traveled on the plane. An alternative approach is to add the $60 to the $1,800 and repeat requirement 1: a. b. Stand-alone cost allocation method: Baltimore employer $1,460 ($1,460 + $1,160) $1,860 = $1,036 Chicago employer $1,160 ($1,460 + $1,160) $1,860 = $ 824 Incremental cost allocation method. With Baltimore employer as the primary party: Baltimore employer Chicago employer $1,460 400 $1,860 With Chicago employer as the primary party: Chicago employer Baltimore employer c. $1,160 700 $1,860 Using Shapley value, Baltimore employer: (1,460 + $700) ÷ 2 = $1,080 Chicago employer: ($400 + $1,160) ÷ 2 = $780 Note: Ask any students in the class how they handled this situation if they have faced it. 15-5 15-25 (2025 min.) Revenue allocation, bundled products. 1. (a) The stand-alone revenues (using unit selling prices) of the three components of the $700 package are: Lodging Recreation Food $320 × 2 = $ 640 $150 × 2 = 300 $ 80 × 2 = 160 $1,100 Lodging $640 $1,100 × $700 = 0.582 × $700 = $407 Recreation $300 $1,100 × $700 = 0.273 × $700 = $191 Food $160 $1,100 × $700 = 0.145 × $700 = $102 b. Revenue Allocated $300 400 0 $700 Product Recreation Lodging Food Revenue Remaining to Be Allocated to Other Products $700 $300 = $400 $400 $400 = $ 0 2. The pros of the stand-alone-revenue-allocation method include: a. Each item in the bundle receives a positive weight, which means the resulting allocations are more likely to be accepted by all parties than a method allocating zero revenues to one or more products. b. Uses market-based evidence (unit selling prices) to decide the revenue allocations—unit prices are one indicator of benefits received . c. Simple to implement. a. The cons of the stand-alone revenue-allocation method include: Ignores the relative importance of the individual components in attracting consumers to purchase the bundle. b. Ignores the opportunity cost of the individual components in the bundle. The golf course operates at 100% capacity. Getaway participants must reserve a golf booking one week in advance, or else they are not guaranteed playing time. A getaway participant who does not use the golf option may not displace anyone. Thus, under the stand-alone method, the golf course may be paid twice--once from the non-getaway person who does play and second from an allocation of the $700 package amount for the getaway person who does not play (either did not want to play or wanted to play but made a booking too late). 15-6 c. The weight can be artificially inflated by individual product managers setting "high" list unit prices and then being willing to frequently discount these prices. The use of actual unit prices or actual revenues per product in the stand-alone formula will reduce this problem. d. The weights may change frequently if unit prices are constantly changing. This is not so much a criticism as a reflection that the marketplace may be highly competitive. The pros of the incremental method include: a. It has the potential to reflect that some products in the bundle are more highly valued than others. Not all products in the bundle have a similar "write-down" from unit list prices. Ensuring this "potential pro" becomes an "actual pro" requires that the choice of the primary product be guided by reliable evidence on consumer preferences. This is not an easy task. b. Once the sequence is chosen, it is straightforward to implement. The cons of the incremental method include: a. Obtaining the rankings can be highly contentious and place managers in a "no-win" acrimonious debate. The revenue allocations can be highly sensitive to the chosen rankings. b. Some products will have zero revenues assigned to them. Consider the Food division. It would incur the costs for the two dinners but receive no revenue. 15-32 (40-60 min.) Support department cost allocations; single-department cost pools; direct, step-down, and reciprocal methods. All the following computations are in dollars. 1. Direct method: To X To Y A 250/400 $100,000 = $62,500 150/400 $100,000 = $37,500 B 100/500 $ 40,000 = 8,000 400/500 $40,000 = 32,000 Total $70,500 $69,500 Step-down method, allocating A first: A $100,000 (100,000) — $ 0 B $40,000 20,000 (60,000) $ 0 X — $50,000 12,000 $62,000 Y — $30,000 48,000 $78,000 A Costs to be allocated $100,000 Allocate B: (500; 100; 400 ÷ 1,000) 20,000 Allocate A: (250/400, 150/400) (120,000) Total $ 0 B $ 40,000 (40,000) — $ 0 X — $ 4,000 75,000 $79,000 Y — $16,000 45,000 $61,000 Costs to be allocated Allocate A: (100; 250; 150 ÷ 500) Allocate B: (100; 400 ÷ 500) Total Step-down method, allocating B first: Note that these methods produce significantly different results, so the choice of method may frequently make a difference in the budgeted department overhead rates. 15-7 Reciprocal method: Stage 1: Let A = B = (1) A = (2) B = total costs of materials-handling department total costs of power-generating department $100,000 + 0.5B $ 40,000 + 0.2A Stage 2: Substituting in (1): A A 0.9A A Substituting in (2): = = = = $100,000 + 0.5($40,000 + 0.2A) $100,000 + $20,000 + 0.1A $120,000 $133,333 B = $40,000 + 0.2($133,333) B = $66,666 Stage 3: Original amounts Allocation of A Allocation of B Totals accounted for A 100,000 (133,333) 33,333(50%) — B 40,000 26,666(20%) (66,666) — X Y — — 66,667(50%) 40,000(30%) 6,667(10%) 26,666(40%) 73,334 66,666 SOLUTION EXHIBIT 15-32 Reciprocal Method of Allocating Support Department Costs for Manes Company Using Repeated Iterations. Support Departments A B Budgeted manufacturing overhead costs before any interdepartmental cost allocations 1st Allocation of Dept. A: (2/10, 5/10, 3/10)a 1st Allocation of Dept. B (5/10, 1/10, 4/10)b 2nd Allocation of Dept. A (2/10, 5/10, 3/10)a 2nd Allocation of Dept B: (5/10, 1/10, 4/10)b 3rd Allocation of Dept A: (2/10, 5/10, 3/10)a 3rd Allocation of Dept. B: (5/10, 1/10, 4/10)b 4th Allocation of Dept. A (2/10, 5/10, 3/10)a 4th Allocation of Dept. B (5/10, 1/10, 4/10)b 5th Allocation of Dept A (2/10, 5/10, 3/10) 5th Allocation of Dept B (5/10, 1/10, 4/10) 6th Allocation of Dept A (2/10, 5/10, 3/10) Total budgeted manufacturing overhead of operating departments $100,000 (100,000) $40,000 20 ,000 60 ,000 $50,000 $30,000 30,000 (60,000) 6,000 24,000 (30,000) 6,000 15,000 9,000 3,000 (6,000) 600 2,400 1,500 900 (3,000) $ Operating Departments X Y 600 300 (600) 60 240 (300) 60 150 90 30 (60) 6 24 (30) 6 15 9 3 (6) 1 2 (3) 0 2 1 0 $73,334 $66,666 0 15-8 $ Total accounts allocated and reallocated (the numbers in parentheses in first two columns) Plant Maintenance: $100,000 + $30,000 + $3,000 + $300 + $30 + $3 = $133,333 Information Systems: $60,000 + $6,000 + $600 + $60 + $6 = $66,666 aBase bBase is (100 + 250 +150) or 500 labor-hours; 100 ÷ 500 = 2/10, 250 ÷ 500 = 5/10, 150 ÷ 500 = 3/10. is (500 + 100 + 400) or 1,000 kwhours ; 500 ÷ 1,000 = 5/10, 100 ÷ 1,000 = 1/10, 400 ÷ 1,000 = 4/10. Comparison of methods: Method of Allocation Direct method Step-down: A first Step-down: B first Reciprocal method X $70,500 62,000 79,000 73,334 Y $69,500 78,000 61,000 66,666 Note that in this case the direct method produces answers that are the closest to the "correct" answers (that is, those from the reciprocal method), step-down allocating B first is next, and stepdown allocating A first is least accurate. 2. At first glance, it appears that the cost of power is $40 per unit plus the material handling costs. If so, Manes would be better off by purchasing from the power company. However, the decision should be influenced by the effects of the interdependencies and the fixed costs. Note that the power needs would be less (students miss this) if they were purchased from the outside: Outside Power Units Needed 100 400 X Y A (500 units minus 20% of 500 units, because there is no need to service the nonexistent power department) Total units 400 900 Total costs, 900 $40 = $36,000 In contrast, the total costs that would be saved by not producing the power inside would depend on the effects of the decision on various costs: 15-9 Avoidable Costs of 1000 Units of Power Produced Inside Variable indirect labor and indirect material costs Supervision in power department Materials handling, 20% of $70,000* Probable minimum cost savings Possible additional savings: a. Can any supervision in materials handling be saved because of overseeing less volume? Minimum savings is probably zero; the maximum is probably 20% of $10,000 or $2,000. b. Is any depreciation a truly variable, wear-and-tear type of cost? Total savings by not producing 1000 units of power $10,000 10,000 14,000 $34,000 ? ? _____ $34,000 + ? * Materials handling costs are higher because the power department uses 20% of materials handling. Therefore, materials-handling costs will decrease by 20%. In the short run (at least until a capital investment in equipment is necessary), the data suggest continuing to produce internally because the costs eliminated would probably be less than the comparable purchase costs. 15-33 (25 min.) Common costs. 1. Miller = 900 $1.00 × ($1,200) (900 $1.00) (600 $1.00) = $900 × $1,200 = $720 $900 $600 Jackson = = 600 $1.00 × ($1,200) (600 $1.00) (900 $1.00) $600 × $1,200 = $480 $600 $900 15-10 2. Party Miller (primary) Jackson (incremental) Costs Remaining to be Allocated $300 ($1,200 – $900) $ 0 Costs Allocated $900 $300 If Jackson is the primary party, the allocation would be Party Jackson (primary) Miller (incremental) Cost Remaining To be Allocated $600 ($1,200 – $600) $ 0 Costs Allocated $600 $600 3. Another approach is to use the Shapley value and consider each party as first the primary party and then the incremental party. Then the average of the two is computed to determine the allocation. Miller: Allocation as the primary party Allocation as the incremental party Total Allocation ($1,500 ÷ 2) $ 900 600 $1,500 $ 750 Jackson: Allocation as the primary party Allocation as the incremental party Total Allocation ($900 ÷ 2) $ 600 300 $ 900 $ 450 Using this approach, Miller is allocated $750 and Jackson is allocated $450 out of the total costs of $1,200. Miller and Jackson could also use the stand-alone cost allocation method to allocate the rent: Miller, $720; Jackson, $480. If they used the incremental cost-allocation method, Miller and Jackson would probably have disputes over who is the primary party because the primary party gets allocated all costs first. 15-34 (50-60 min.) Revenue allocation, bundled products. 1a. Stand-alone revenues in 2003: Fraîche ($100 × 20,000) Désarmer ($80 × 37,500) Innocence ($250 × 20,000) $2,000,000 3,000,000 5,000,000 The weights for Fraîche + Désarmer suite: $2 million Fraîche: × $150 = $60 $2 million $3 million 15-11 Désarmer: $3 million × $150 = $90 $2 million $3 million The weights for Fraîche + Innocence suite: $2 million Fraîche: × $280 = $80 $2 million $5 million Innocence: $5 million × $280 = $200 $2 million $5 million b. Fraîche + Désarmer suite: Revenue Product Allocated Désarmer $ 80 Fraîche 70 Total revenue allocated $150 Revenue Remaining to be Allocated $70 ($150 – $80) 0 Fraîche + Innocence suite: Product Innocence Fraîche Total revenue allocated Revenue Allocated $250 30 $280 Revenue Remaining to be Allocated $30 ($280 – $250) 0 2. Each product will be considered as a primary product and first incremental product. An average revenue is the final revenue allocation to the product. This approach is illustrated below. Fraîche + Désarmer suite: Fraîche Allocation as the primary product Allocation as the incremental product ($150 – $80) Total Allocation ($170 ÷ 2) Désarmer Allocation as the primary product Allocation as the incremental product ($150 – $100) Total Allocation ($130 ÷ 2) $100 70 $170 $ 85 $ 80 50 $130 $ 65 According to this approach, Fraîche’s revenue allocation is $85 and Désarmer’s revenue allocation is $65 out of the total suite revenue of $150. 15-12 Fraîche + Innocence suite: Fraîche Allocation as the primary product Allocation as the incremental product ($280 – $250) Total Allocation ($130 ÷ 2) Innocence Allocation as the primary product Allocation as the incremental product ($280 – $100) Total Allocation ($430 ÷ 2) $100 30 $130 $ 65 $250 180 $430 $215 Fraîche is allocated $65 revenue and Innocence is allocated $215 revenue out of the total suite revenue of $280. An alternative approach is to take into account both the price and the units sold, that is, total revenues from each product when calculating the weights. On a stand-alone basis, the price of Fraîche plus Désarmer is $100 + $80 = $180. On a stand-alone basis the revenues are Fraîche $2,000,000 Désarmer 3,000,000 Total $5,000,000 So Fraîche accounts for 40% ($2,000,000 ÷ $5,000,000) and Désarmer 60% ($3,000,000 ÷ 5,000,000) of total revenues from Fraîche and Désarmer. Applying these percentages to the total stand-alone price of $180, we get revenueweighted prices of $180 40% = $72 for Fraîche and $180 60% = $108 for Désarmer. Using these revenue-weighted prices and considering each product as the primary product and then the incremental product: Fraîche and Désarmer suite: Fraîche Allocation as the primary product Allocation as the incremental product ($150 – $108) Total Allocation ($114 ÷ 2) Désarmer Allocation as the primary product Allocation as the incremental product ($150 – $72) Total Allocation ($186 ÷ 2) 15-13 $ 72 42 $114 $ 57 $108 78 $186 93 On a stand-alone basis, the price of Fraîche + Innocence is $100 + $250 = $350. On a stand-alone basis, the revenues are Fraîche $2,000,000 Innocence $5,000,000 Total $7,000,000 So Fraîche accounts for 2/7 ($2,000,000 ÷ $7,000,000) and Innocence 5/7 ($5,000,000 ÷ $7,000,000) of total revenues from Fraîche and Innocence. Applying these percentages to the total stand-alone price of $350, we get revenueweighted prices of $350 2/7 = $100 for Fraîche and $350 5/7 = $250 for Innocence. Using these revenue-weighted prices and considering each product as the primary product and then the incremental product: Fraîche and Innocence suite: Fraîche Allocation as the primary product Allocation as the incremental product ($280 – $250) Total Allocation ($130 ÷ 2) Innocence Allocation as the primary product Allocation as the incremental product ($280 – $100) Total Allocation ($430 ÷ 2) $100 30 $130 $ 65 $250 $180 $430 $215 A summary of the price allocations for the bundled products under different methods follows Shapely Incremental Value Incremental With Shapley Based on Stand-alone With Désarmer/ Value RevenueRevenue Fraîche Innocence Based on Weighted Allocation Primary Primary Price Price (1) (2) (3) (4) (5) $ 60 $100 $ 70 $ 85 $ 57 Fraîche 90 50 80 65 93 Désarmer Total $150 $150 $150 $150 $150 $ 80 $100 $ 30 $ 65 $ 65 Fraîche Innocence 200 180 250 215 215 Total $280 $280 $280 $280 $280 Note that the Shapley value calculations based on price and revenue-weighted prices are the same for Fraîche and Innocence because the same number of units of each of these products is sold (20,000 units). In general, the Shapely value calculations based on revenue-weighted prices gives the most fair allocation of prices to each product in the bundle because it considers not only the prices of each product sold but also the units. Thus, if one of the products in the 15-14 bundle sells very few units, it gets very few revenues allocated to it even if it sells for a high price. The table above also indicates that the stand-alone revenue allocation method closely approximates the Shapley value calculations based on revenue-weighted prices. Note that columns 2, 3, and 4 in the above table all allocate more revenues with Fraîche-Désarmer bundle to Fraîche because Fraîche sells for a higher price ($100 versus $80). But the allocations in these columns ignore the important fact that Fraîche sells far fewer units than Désarmer (20,000 versus 37,500). 15-15


