Economics 1 Cost & Price Taker Homework Page 1 Irvine Valley
advertisement
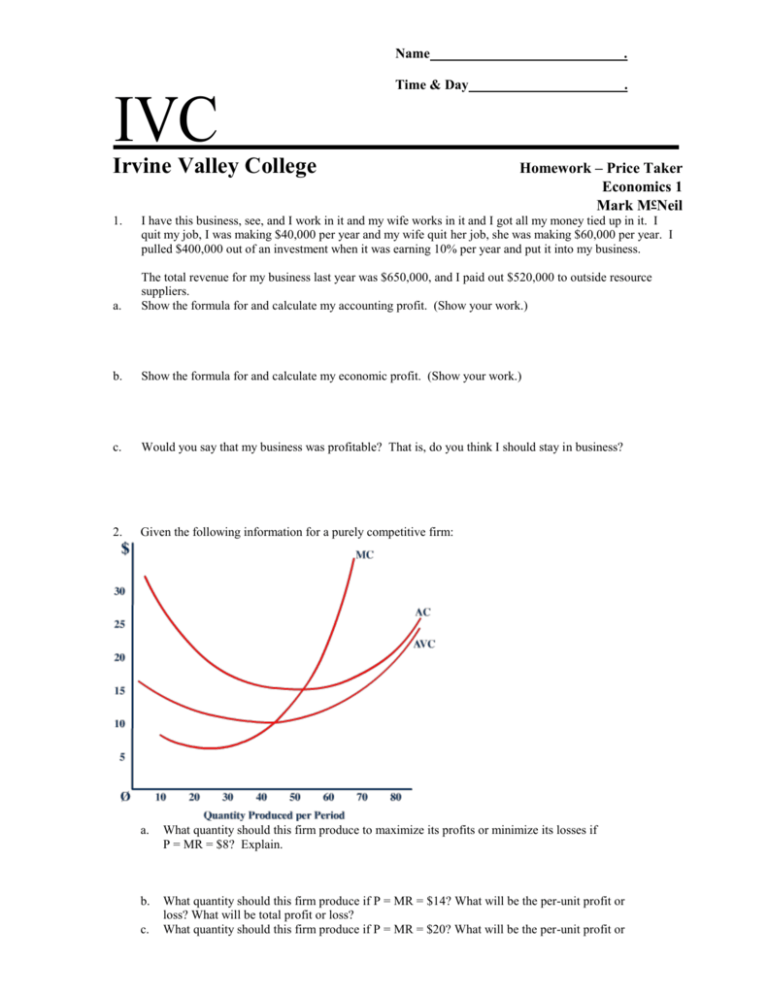
Name . Time & Day . IVC Irvine Valley College 1. Homework – Price Taker Economics 1 Mark McNeil I have this business, see, and I work in it and my wife works in it and I got all my money tied up in it. I quit my job, I was making $40,000 per year and my wife quit her job, she was making $60,000 per year. I pulled $400,000 out of an investment when it was earning 10% per year and put it into my business. a. The total revenue for my business last year was $650,000, and I paid out $520,000 to outside resource suppliers. Show the formula for and calculate my accounting profit. (Show your work.) b. Show the formula for and calculate my economic profit. (Show your work.) c. Would you say that my business was profitable? That is, do you think I should stay in business? 2. Given the following information for a purely competitive firm: a. What quantity should this firm produce to maximize its profits or minimize its losses if P = MR = $8? Explain. b. What quantity should this firm produce if P = MR = $14? What will be the per-unit profit or loss? What will be total profit or loss? What quantity should this firm produce if P = MR = $20? What will be the per-unit profit or c. Economics 1 Cost & Price Taker Homework Page 2 loss? What will be total profit or loss? Show these on the diagram. 3. Use the data from the spreadsheet next to the link to this homework, posted under “Exercises” on the web page to complete the following 5 lines. If the price is $410, what quantity will the firm choose to produce? What will be total revenue? Total cost, and total profit. Then, what is price is $342, $325, etc. Complete the excel spreadsheet and attach it as the last page of this homework. I prefer that you use Excel to complete the cost sheet. Attach it to this homework. If P = Q= TR TC T Profit $410 342 325 201 182 $ $ S1 150 150 125 125 100 100 75 AC AVC 75 D 1 50 25 50 25 Ø 4. MC Q 1 a. b. Q Ø 5 10 15 20 25 30 35 40 Quantity Produced per Period Show the quantity the “typical” firm will produce at the current market price of $100. Is this firm earning economic profit (or loss)? Show this on the diagram on the right and explain. c. What price would expect to exist in the long run? Explain the process of long run adjustment that brings about the long run price. Show these changes on the diagram. 5. Given the long run average cost curve for a firm: Economics 1 Cost & Price Taker Homework a. At what level of output will the firm experience the minimum efficient plant scale? b. Economies of scale exist between _______________ and ________________ units of output. c. Diseconomies of scale exist between _______________ and ________________ units of output. d. Are there any constant returns? Page 3
