Refrigeration
advertisement
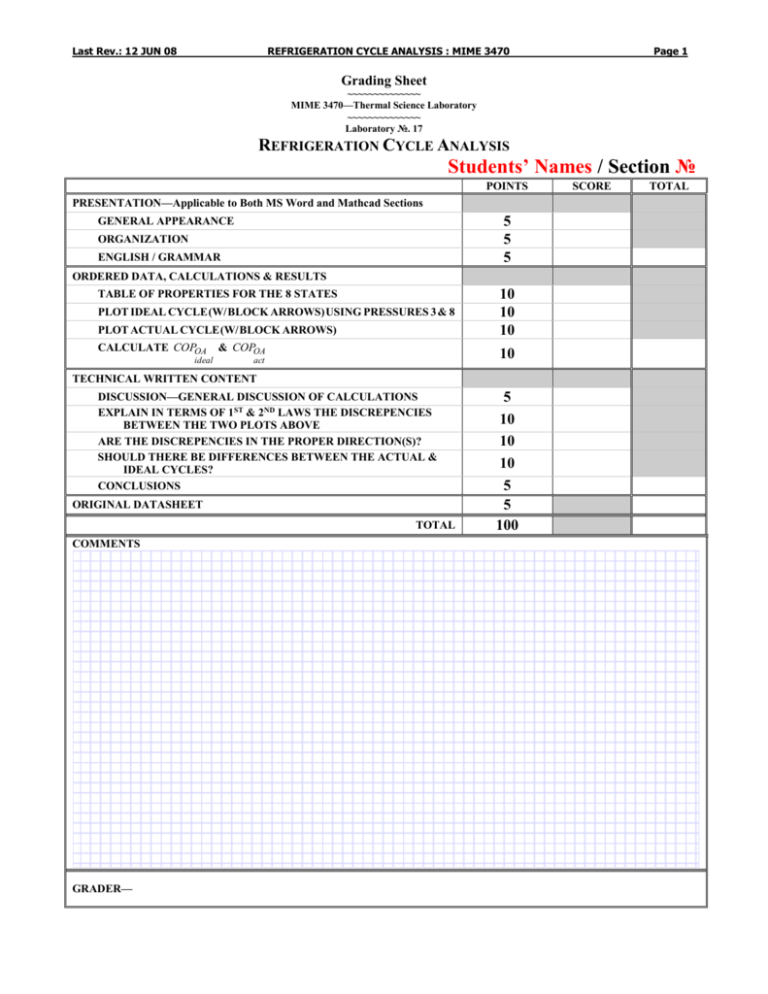
Last Rev.: 12 JUN 08 REFRIGERATION CYCLE ANALYSIS : MIME 3470 Page 1 Grading Sheet ~~~~~~~~~~~~~~ MIME 3470—Thermal Science Laboratory ~~~~~~~~~~~~~~ Laboratory №. 17 REFRIGERATION CYCLE ANALYSIS Students’ Names / Section № POINTS PRESENTATION—Applicable to Both MS Word and Mathcad Sections 5 5 5 GENERAL APPEARANCE ORGANIZATION ENGLISH / GRAMMAR ORDERED DATA, CALCULATIONS & RESULTS PLOT ACTUAL CYCLE (W/ BLOCK ARROWS) 10 10 10 CALCULATE COPOA 10 TABLE OF PROPERTIES FOR THE 8 STATES PLOT IDEAL CYCLE (W/ BLOCK ARROWS) USING PRESSURES 3 & 8 ideal & COPOA act TECHNICAL WRITTEN CONTENT DISCUSSION—GENERAL DISCUSSION OF CALCULATIONS EXPLAIN IN TERMS OF 1ST & 2ND LAWS THE DISCREPENCIES BETWEEN THE TWO PLOTS ABOVE ARE THE DISCREPENCIES IN THE PROPER DIRECTION(S)? SHOULD THERE BE DIFFERENCES BETWEEN THE ACTUAL & IDEAL CYCLES? CONCLUSIONS ORIGINAL DATASHEET TOTAL COMMENTS d GRADER— 5 10 10 10 5 5 100 SCORE TOTAL Last Rev.: 12 JUN 08 REFRIGERATION CYCLE ANALYSIS : MIME 3470 R h1 h4 Q evap m MIME 3470—Thermal Science Laboratory ~~~~~~~~~~~~~~ Laboratory №. 17 m R = mass flow of refrigerant through the system. Therefore, from Equation 1, the ideal COP is Q evap h1 h4 . (5) COPOAideal W comp h2 h1 ~~~~~~~~~~~~~~ NAME NAME NAME TIME, DATE Condenser Compressor Valve Constant p Wcomp Evaporator Q evap s air c p Tin Q evap m Toutevap evap air evap air where, m = evap (1) Compressor Wcomp p1 s Evaporator Q evap Figure 2—Schematic and T-s diagram for a vapor-compression refrigeration cycle including irreversibilities in all components The refrigeration cycle for an actual cycle is presented in Figure 2. This cycle varies from the ideal in that the compression process is nonisentropic (States 1 to 2) and there are pressure losses across both the evaporator (States 7 to 8) and the condenser (States 3 to 4). The cooling capacity, Q evap , and the heat load from the condenser, Q cond , are R h8 h7 Q evap m (6) and Q cond m R h3 h4 (7) and air c p Tin Q cond m Toutcond air cond (8) air temperatures in and out of the condenser. Equation 3 would be valid for an actual cycle only if the compression and combination compressor-motor efficiencies were both unity. The compression efficiency, comp , and the compressor- comp and c -m h2 s h1 h2 h1 w R h2 s h 1 W (2) mass flow of air through the evaporator c pair = specific heat of air Tinevap = temperature of air entering the evaporator Toutevap = temperature of air leaving the evaporator The refrigeration cycle in Figure 1 is an ideal cycle. It is ideal because the compression process is isentropic (States 1 to 2) and there are no pressure losses across either the evaporator (States 4 to 1) or the condenser (States 2 to 3). The power to the compressor and the cooling capacity for the ideal refrigeration cycle are R h2 h1 (3) W comp m (9) (10) comp Therefore, the cycle overall COP for actual cycle is h h COPOA 8 7 h2 h1 act electric power to the compressor motor. From the First Law, the cooling capacity is p8 motor efficiency, c-m , are defined by ANALYSIS—The performance of a refrigeration cycle is given in terms of the Coefficient of Performance or COP and the cooling capacity Q evap . The overall COP for the cycle is COPOA Q evap Wcomp Figure 1—Schematic and T-s process diagram of an ideal vapor-compression refrigeration cycle where, Wcomp = Condenser Equation 8 is obtained from an energy balance across the air side of the condenser. The temperatures Tincond and Toutcond are the Expansion (Throttling) Constanth Q cond T OBJECTIVE—of this exercise is to determine the various coefficients of performance, COP. Specifically, these are the ideal and actual cycle COPs using the attached thermodynamic diagram for Refrigerant-12 (R12). INTRODUCTION—A refrigeration cycle is a cycle which transfers heat from a low temperature sink to a high temperature sink by the application of energy from a third source. A refrigeration cycle differs from what is commonly called a heat pump in that the desired output is the heat transfer from the cold sink rather than the heat transfer to the hot sink. The most common type of refrigeration cycle is the mechanical vapor compression cycle. This cycle is essentially a Rankine Cycle run backwards. A schematic and a T-s diagram of the cycle appears in Figure 1. The cycle is referred to as a mechanical compression because the compression process (States 1 to 2) is accomplished by a mechanical compressor that is driven by an external power source. This source is usually an electric motor. Constant p Q cond p 2 ~~~~~~~~~~~~~~ T (4) where, REFRIGERATION CYCLE ANALYSIS LAB PARTNERS: NAME NAME NAME SECTION № EXPERIMENT TIME/DATE: Page 2 (11) PROCEDURE—Turn on and study the cycle and the components of the refrigeration unit shown in Figure 3. Trace the R12 flow path and identify the compressor, evaporator, condenser, and expansion valve inlets and outlets. Make sure that the flow path is correct by opening and closing the proper valves. For the unit to act on a refrigeration cycle, the flow from the evaporator must go to the top of the compressor. After the unit has stabilized, take temperature and pressure data for flows into and out of the a. Compressor (States 1 and 2) b. Condenser (States 3 and 4) c. Expansion valve (States 5 and 6) d. Evaporator (States 7 and 8). Last Rev.: 12 JUN 08 REFRIGERATION CYCLE ANALYSIS : MIME 3470 Page 3 For the Report NOTE: This experiment is to be done in English units only. This is because the only pressure-enthalpy diagram for Freon-12 we have access to is in English units. 1. Make a table (supplied below) of state properties (p, T, v, h, and s) for the eight states of the cycle. 2. On the supplied p-h chart, plot the ideal cycle for the appropriate conditions of our experimental data. The student is to use Pressures 3 and 8 to determine the ideal cycle. Be sure to indicate with block arrows across the lines the occurrences of Q cond m , Q evap m , and W comp m . 3. Redo Item 2 using the actual cycle data points. This plot should appear on the same sheet as that of Item 2. 4. Calculate COPOA and COPOA ideal Figure 3—Refrigeration cycle experimental setup act 5. Explain in terms of the First and Second Laws Thermodynamics, the nature of the discrepancies between cycle paths in Items 2 and 3. Are the discrepancies in proper direction(s)? Should there be differences between actual and ideal cycles? of the the the ORDERED DATA, CALCULATIONS, and RESULTS REMEMBER: DO THIS ONE IN ENGLISH UNITS ONLY Requirement 1: Make a table of state properties (p, T, v, h, and s) for the eight states of the cycle. State Compressor Compressor Condenser Condenser Expansion Expansion Evaporator Evaporator Data In Out In Out Valve In Valve Out In Out p(psi) gage p(psi) absolute (+14.7psi) T(F) v(ft3/lbm) h(Btu/lbm) s(Btu/lbmR) Requirement 4.Calculate COPOA and COPOA . ideal act The student may want to use the Mathcad object (below) for this. Otherwise, feel free to delete the object. MATHCAD OBJECT--DOUBLE CKICK TO OPEN YOU MAY NOT CHOOSE TO USE MATHCAD ON THIS LAB. THE OBJECT IS PRESENTED IF YOU WANT IT. OTHERWISE DELETE THE OBJECT. Last Rev.: 12 JUN 08 REFRIGERATION CYCLE ANALYSIS : MIME 3470 Page 4 Requirements 2 & 3. On the supplied p-h chart, plot the ideal cycle for the appropriate conditions of our experimental data. The student is to use Pressures 3 and 8 to determine the ideal cycle. Be sure to indicate with block arrows across the lines the occurrences of Q cond m , Q evap m , and W comp m . Redo Item 2 using the actual cycle data points. This plot should appear on the same sheet as that of Item 2. Q cond m IDEAL CYCLE ACTUAL CYCLE Last Rev.: 12 JUN 08 REFRIGERATION CYCLE ANALYSIS : MIME 3470 DISCUSSION OF RESULTS Explain in terms of 1st and 2nd Laws the discrepencies between the two plots. Answer: Are the discrepencies in the proper directions? Answer: Should there be differences between the actual and ideal cycles? Answer: CONCLUSIONS Page 5 Last Rev.: 12 JUN 08 REFRIGERATION CYCLE ANALYSIS : MIME 3470 Page 6 APPENDICES APPENDIX A—DATA SHEET FOR REFRIGERATION CYCLE ANALYSIS NOTE: 1. THE CONDENSOR IS ON THE HIGH PRESSURE SIDE Q cond Condenser WHILE THE EVAPORATOR IS ON THE LOW PRESSURE SIDE 2. ALL PRESSURE DATA ARE GAGE PRESSURES; HOWEVER, THE PROPERTY TABLES USE ABSOLUTE PRESSURE—BE SURE TO CONVERT TO ABSOLUTE BEFORE LOOKING UP PROPERTIES. ___________________________ Lab Partners: ___________________________ ___________________________ p(psi) T(F) ___________________________ ___________________________ ___________________________ ___________________________ Compressor In d d Compressor Out Condenser In Compressor Wcomp Time/Date: State Data Condenser Out Expansion Valve In Expansion Valve Out Evaporator Q evap Evaporator In Evaporator Out Last Rev.: 12 JUN 08 REFRIGERATION CYCLE ANALYSIS : MIME 3470 APPENDIX B—R-12 (CCl2F2) THERMODYNAMIC PROPERTIES Saturated Superheated v(ft3/lbm), u(Btu/lbm), h(Btu/lbm), s(Btu/lbm°R) Page 7 Last Rev.: 12 JUN 08 REFRIGERATION CYCLE ANALYSIS : MIME 3470 APPENDIX C—BIOGRAPHIC SKETCHES The Father of Cool Willis Haviland Carrier—The History of Air Conditioning By Mary Bellis “I fish only for edible fish, and hunt only for edible game even in the laboratory.” — Willis Haviland Carrier on being practical. In 1902, only one year after Willis Haviland Carrier graduated from Cornell University with a Masters in Engineering, the first air (temperature and humidity) conditioning was in operation, making one Brooklyn printing plant owner very happy. Fluctuations in heat and humidity in his plant had caused the dimensions of the printing paper to keep altering slightly, enough to ensure a misalignment of the colored inks. The new air conditioning machine created a stable Willis Haviland Carrier environment and aligned four-color printing became possible. All thanks to the new employee at the Buffalo Forge Company, who started on a salary of only $10 per week. The ‘Apparatus for Treating Air’ (U.S. Pat# 808897) granted in 1906, was the first of several patents awarded to Willis Haviland Carrier. The recognized ‘father of air conditioning’ is Carrier, but the term ‘air conditioning’ actually originated with textile engineer, Stuart H. Cramer. Cramer used the phrase ‘air conditioning’ in a 1906 patent claim filed for a device that added water vapor to the air in textile plants—to condition the yarn. In 1911, Willis Haviland Carrier disclosed his basic Rational Psychrometric1 Formulae to the American Society of Mechanical Engineers. The formula still stands today as the basis in all fundamental calculations for the air conditioning industry. Carrier said he received his ‘flash of genius’ while waiting for a train. It was a foggy night and he was going over in his mind the problem of temperature and humidity control. By the time the train arrived, Carrier had an understanding of the relationship between temperature, humidity and dew point. Industries flourished with the new ability to control the temperature and humidity levels during and after production. Film, tobacco, processed meats, medical capsules, textiles and other products acquired significant improvements in quality with air conditioning. Willis and six other engineers formed the Carrier Engineering Corporation in 1915 with a starting capital of $35,000 (1995 sales topped $5 billion). The company was dedicated to improving air conditioning technology. In 1921, Willis Haviland Carrier patented the centrifugal refrigeration machine. The ‘centrifugal chiller’ was the first practical method of air conditioning large spaces. Previous refrigeration machines used reci-procating-compressors (piston-driven) to pump refrigerant (often toxic and flammable ammonia) throughout the system. Carrier desig-ned a centrifugal-compressor similar to the centrifugal turning- 1 psy·chrom·e·ter n. : a hygrometer consisting essentially of two similar thermometers with the bulb of one being kept wet so that the cooling that results from evaporation makes it register a lower temperature than the dry one and with the difference between the readings constituting a measure of the dryness of the atmosphere. psy·chro·met·ric adj. psy·chrom·e·try n. NOT TO BE CONFUSED WITH psy·chom·e·try n. 1 : divination of facts concerning an object or its owner through contact with or proximity to the object. psy·cho·met·rics pl. n. but sing. in construction: the psychological theory or technique of mental measurement http://www.merriam-webster.com Page 8 blades of a water pump. The result was a safer and more efficient chiller. Cooling for human comfort, rather than industrial need, began in 1924, noted by the three Carrier centrifugal chillers installed in the J.L. Hudson Department Store in Detroit, Michigan. Shoppers flocked to the air conditioned store. The boom in human cooling spread from the department stores to the movie theaters, most notably the Rivoli Theater in New York, whose summer film business skyrocketed when it heavily advertised the cool comfort. Demand increased for smaller units and the Carrier Company obliged. In 1928, Willis Haviland Carrier developed the first residential ‘Weathermaker’, an air conditioner for private home use. The Great Depression and then WW2 slowed the non-industrial use of air conditioning. After the war, consumer sales started to grow again. The rest is history, cool and comfortable history. Willis Haviland Carrier did not invent the very first system to cool an interior structure, however, his system was the first truly successful and safe one that started the science of modern air conditioning. Special thanks given to the Carrier Corporation http://inventors.about.com/library/weekly/aa081797.htm WILLIS CARRIER by John H. Lienhard It was a hot August day in San Antonio, Texas. I was there to name the Milam Building as a Mechanical Engineering Landmark. I went from the hot street into the cool halls of this fine old 21-story Art Deco building. As if by magic, the weather changed from awful to pleasant as I entered. This was no ordinary magic. You see, this was the first airconditioned office building in the world. Inside, I met representatives of the Carrier Corporation. They were proud this day. In 1928, their company installed the original system here. Of course everyone invoked the name of Willis Carrier. Carrier’s mother had some of that creative magic. For she had a mechanic’s instincts. Carrier learned about math and machines from his mother. Carrier was poor. He waited tables, earned scholarships, and sold stereopticon slides to get through engineering school at Cornell. In 1901, he went on to work for the Buffalo Forge Company. There he designed heating and cooling equipment. He soon saw how little we knew about regulating the temperature and humidity of air. He went to work on the problem. By 1911, he’d written the science of psychrometry. It describes air temperature and humidity. But Carrier did much more. He’d already begun creating a technology for controlling air condition. In 1907, Buffalo Forge saw the value of his work. They formed The Carrier Air Conditioning Corporation of America as a subsidiary. Air conditioning spread across America. First theaters and churches. Then more complex structures. If you’re old enough, you remember the early air-conditioned movie theaters. They used to paint blue ice cubes on their marquees. Carrier died in 1950. Now the Houston temperature climbs. And I too say “Thank God!” for the magic that makes this sultry climate so pleasant—all year round. Engines of Our Ingenuity, № 688 http://www.uh.edu/engines/epi688.htm
