AP Biology Name__________________________Per______ Pre
advertisement
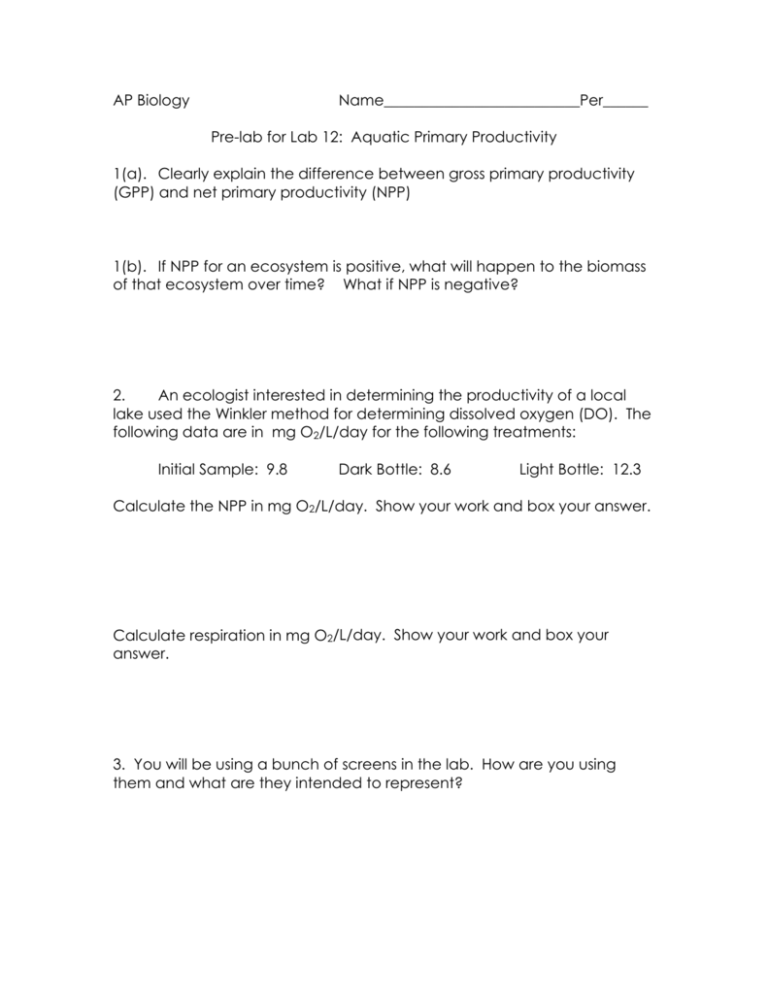
AP Biology Name__________________________Per______ Pre-lab for Lab 12: Aquatic Primary Productivity 1(a). Clearly explain the difference between gross primary productivity (GPP) and net primary productivity (NPP) 1(b). If NPP for an ecosystem is positive, what will happen to the biomass of that ecosystem over time? What if NPP is negative? 2. An ecologist interested in determining the productivity of a local lake used the Winkler method for determining dissolved oxygen (DO). The following data are in mg O2/L/day for the following treatments: Initial Sample: 9.8 Dark Bottle: 8.6 Light Bottle: 12.3 Calculate the NPP in mg O2/L/day. Show your work and box your answer. Calculate respiration in mg O2/L/day. Show your work and box your answer. 3. You will be using a bunch of screens in the lab. How are you using them and what are they intended to represent? 4. Circle the correct answer from each pair: Oxygen dissolves better in (Hotter or Colder) water. (Salty or Fresh) Exercise 12.1: Dissolved Oxygen and Temperature. You will observe the Winkler Method for measuring DO. After the demonstration, complete the data below using a nomogram: Temperature: _____ DO_____ % Saturation______ Exercise 12.2: Measurement of Primary Productivity. Data are DO in ppm (mg/L) for treatments of 24 hours (1 day). % Light Treatment 100% 65% 25% 10% 2% Initial 10.4 NA NA NA NA Dark 7.3 NA NA NA NA Light 12.5 12.6 11.7 10.9 9.6 Calculations 1. In the space below, calculate the respiration rate. Use the appropriate units in your work; give answer with suitable units and significant figures. Box your answer. 2. Neatly show a sample calculation of GPP and NPP for the 100% light treatment in the space below. Again, appropriate units in work and answer. Box your answer. 3. Complete the necessary calculations to fill in the following table: # Screens % Light DO GPP NPP 0 100% 12.5 1 65% 12.6 3 25% 11.7 5 10% 10.9 8 2% 9.6 4. Plot the graph for both the NPP and GPP as a function of light intensity. Two kinds of productivity needs to be plotted on the same graph. For this graph you will need to determine the following: a. The Independent variable:_______________________(x axis) b. The dependent variable: ________________________(y axis) Title of graph: __________________________________(should be descriptive)
