Stem and Leaf Plots Examples, Stem and Leaf Plots Worksheet, and
advertisement
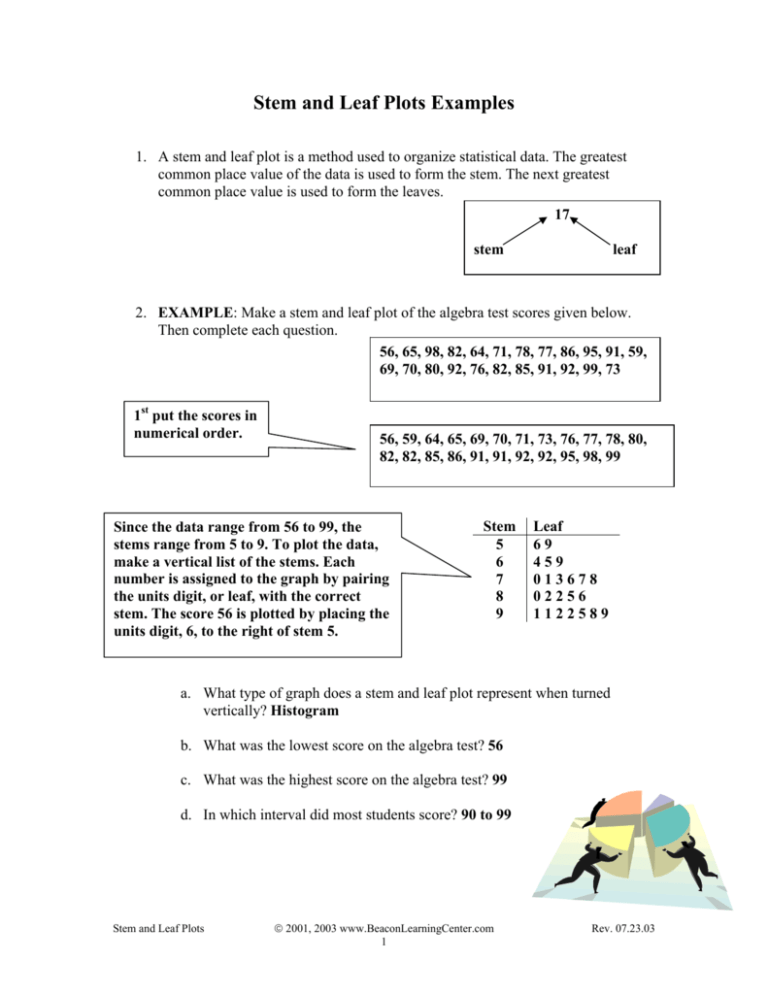
Stem and Leaf Plots Examples 1. A stem and leaf plot is a method used to organize statistical data. The greatest common place value of the data is used to form the stem. The next greatest common place value is used to form the leaves. 17 stem leaf 2. EXAMPLE: Make a stem and leaf plot of the algebra test scores given below. Then complete each question. 56, 65, 98, 82, 64, 71, 78, 77, 86, 95, 91, 59, 69, 70, 80, 92, 76, 82, 85, 91, 92, 99, 73 1st put the scores in numerical order. 56, 59, 64, 65, 69, 70, 71, 73, 76, 77, 78, 80, 82, 82, 85, 86, 91, 91, 92, 92, 95, 98, 99 Since the data range from 56 to 99, the stems range from 5 to 9. To plot the data, make a vertical list of the stems. Each number is assigned to the graph by pairing the units digit, or leaf, with the correct stem. The score 56 is plotted by placing the units digit, 6, to the right of stem 5. Stem 5 6 7 8 9 Leaf 69 459 013678 02256 1122589 a. What type of graph does a stem and leaf plot represent when turned vertically? Histogram b. What was the lowest score on the algebra test? 56 c. What was the highest score on the algebra test? 99 d. In which interval did most students score? 90 to 99 Stem and Leaf Plots © 2001, 2003 www.BeaconLearningCenter.com 1 Rev. 07.23.03 3. EXAMPLE: Make a stem and leaf plot of the history test scores given below. Then complete each question. 65, 82, 73, 91, 95, 86, 78, 69, 80, 88 1st put the scores in numerical order. 65, 69, 73, 78, 80, 82, 86, 88, 91, 95 Since the data range from 65 to 95, the stems range from 6 to 9. To plot the data, make a vertical list of the stems. Each number is assigned to the graph by pairing the units digit, or leaf, with the correct stem. The score 65 is plotted by placing the units digit, 5, to the right of stem 6. Stem 6 7 8 9 Leaf 59 38 0268 15 a. What was the lowest score on the history test? 65 b. What was the highest score on the history test? 95 c. In which interval did most students score? 80 to 89 4. Data with more than two digits can be rounded to two digits before plotting or can be truncated to two digits. To truncate means to cut off. For a stem and leaf plot, you would truncate everything after the second digit. The number 355 would round to 36 The number 355 would truncate to 35 355 Î 36 355 Î 35 a. To what does 389 round? 39 b. To what does 389 truncate? 38 Stem and Leaf Plots © 2001, 2003 www.BeaconLearningCenter.com 2 Rev. 07.23.03 5. A back-to-back stem and leaf plot is sometimes used to compare two sets of data or rounded and truncated values of the same data. In a back-to-back plot, the same stem is used for the leaves of both plots. 6. EXAMPLE: Estimated populations of counties in California are listed below. Make a back-to-back stem and leaf plot of the populations comparing rounded values and truncated values. County Butte Contra Costa Fresno Kern Marin Sacramento Put data into order. Then round and truncate to two digits. Using rounded data, 2|2 represents 215,000 – 224,999 people Stem and Leaf Plots Pop. (thousands) 149 657 515 403 223 783 Normal 149 188 223 299 300 403 515 588 657 679 783 893 Rounded 9 5 2 0 0 0 9 2 8 6 8 9 1 2 3 4 5 6 7 8 County San Bernardina San Francisco San Mateo Santa Barbara Santa Cruz Sonoma Pop (thousands) 893 679 588 299 188 300 POPULATION IN THOUSANDS Rounded (2 digits) Truncated (2 digits) 15 14 19 18 22 22 30 29 30 30 40 40 52 51 59 58 66 65 68 67 78 78 89 89 Truncated 4 8 2 9 0 0 1 8 5 7 8 9 © 2001, 2003 www.BeaconLearningCenter.com 3 Using truncated data, 2|2 represents 220,000 – 229,999 people Rev. 07.23.03 7. EXAMPLE: The enrollments of several small colleges are listed below. Make a back-to-back stem and leaf plot of enrollments comparing rounded values and truncated values. Then answer each question College Miller Business School Capital College Para Professional Institute Parke College State Community Fashion Institute College of Art and Design Franklin Community College Put data into order. Then round and truncate to two digits. Normal 1013 1096 1342 1685 1960 2350 3243 3781 Back-to-back stem and leaf plot Enrollment 1342 1685 1013 2350 3781 1096 1960 3243 Enrollment Rounded (2 digits) Truncated (2 digits) 10 10 11 10 13 13 17 16 20 19 24 23 32 32 38 37 Rounded 7 3 1 0 1 4 0 2 8 2 3 Truncated 0 0 3 6 9 3 2 7 a. What range of student enrollment is represented by 2|4? 2350 - 2449 b. What range of student enrollment is represented by 1|9? 1900 - 1999 Stem and Leaf Plots © 2001, 2003 www.BeaconLearningCenter.com 4 Rev. 07.23.03 Name:________________ Date:____________ Class:____________ Stem and Leaf Plots Worksheet Truncate each number to two digits. 1. 456,876 3. 1,234 2. 34,591 4. 1,234,567 Write the stems that would be used to plot each set of data. 5. 23, 45, 56, 12, 27, 56, 37 6. 8, 11, 23, 37, 31, 42, 59 7. 230, 456, 784, 245, 745, 357 8. 4.5, 6.1, 5.8, 9.8, 4.1, 3.2 Use the stem and leaf plot to answer these questions. 9. What is the best test score? 10. How many students took the test? 11. How many students scored 90? History Test Scores Stem Leaf 6 1 1 4 6 7 8 7 2 3 5 7 9 8 1 3 5 6 6 7 7 8 9 9 0 0 3 4 6 8 9 9 10 0 0 12. What is the lowest score? 13. Find the difference between the high and low scores. Use the ages of the people who attended a gymnastics meet to complete 14 – 17. 14. Make a stem and leaf plot of the data. 15. How many people attended the meet? 16. What are the ages of the youngest and oldest persons attending? AGES: 12, 17, 15, 14, 19, 17, 13, 16, 15, 16, 17, 18, 24, 23, 28, 45, 48, 36, 12, 23, 15, 14, 13, 15, 17, 18, 19, 15, 15, 16, 16, 16, 16, 17 17. Which age group was more widely represented? Stem and Leaf Plots © 2001, 2003 www.BeaconLearningCenter.com 5 Rev. 07.23.03 The stem and leaf plot below gives the truncated average weekly incomes (in hundreds of dollars) of several families. Stem 1 2 3 4 5 6 Leaves 9 9 1 5 1 1 3 4 9 9 0 2 9 5 12 18. What was the highest weekly income? 19. What was the lowest weekly income? 20. Find the difference between the highest and lowest weekly income. 21. How many families earn more than $500 per week? 22. What range does 4|2 represent? Stem and Leaf Plots © 2001, 2003 www.BeaconLearningCenter.com 6 Rev. 07.23.03 Stem and Leaf Plots Worksheet Key Truncate each number to two digits. 1. 456,876 Î 45 3. 1,234 Î 12 2. 34,591 Î 34 4. 1,234,567 Î 12 Write the stems that would be used to plot each set of data. 5. 23, 45, 56, 12, 27, 56, 37 Î 1, 2, 3, 4, 5 6. 8, 11, 23, 37, 31, 42, 59 Î 0, 1, 2, 3, 4, 5 7. 230, 456, 784, 245, 745, 357 Î 2, 3, 4, 5, 6, 7 8. 4.5, 6.1, 5.8, 9.8, 4.1, 3.2 Î 3, 4, 5, 6, 7, 8, 9 Use the stem and leaf plot to answer these questions. 9. What is the best test score? Î 100 10. How many students took the test? Î 30 11. How many students scored 90? Î 2 History Test Scores Stem Leaf 6 1 1 4 6 7 8 7 2 3 5 7 9 8 1 3 5 6 6 7 7 8 9 9 0 0 3 4 6 8 9 9 10 0 0 12. What is the lowest score? Î 61 13. Find the difference between the high and low scores. Î 39 Use the ages of the people who attended a gymnastics meet to complete 14 – 17. 14. Make a stem and leaf plot of the data. Stem 1 2 3 4 Leaf 223344555555666666777778899 3348 6 58 Stem and Leaf Plots © 2001, 2003 www.BeaconLearningCenter.com 7 AGES: 12, 17, 15, 14, 19, 17, 13, 16, 15, 16, 17, 18, 24, 23, 28, 45, 48, 36, 12, 23, 15, 14, 13, 15, 17, 18, 19, 15, 15, 16, 16, 16, 16, 17 Rev. 07.23.03 15. How many people attended the meet? Î 34 16. What are the ages of the youngest and oldest persons attending? Î 12 years and 48 years 17. Which age group was more widely represented? Î teens The stem and leaf plot below gives the truncated average weekly incomes (in hundreds of dollars) of several families. Stem 1 2 3 4 5 6 Leaves 9 9 1 5 1 1 3 4 9 9 0 2 9 5 12 18. What was the highest weekly income? Î $620 - $629 19. What was the lowest weekly income? Î $190 - $199 20. Find the difference between the highest and lowest weekly income. Î $430 21. How many families earn more than $500 per week? Î 3 22. What range does 4|2 represent? Î $420 - $429 Stem and Leaf Plots © 2001, 2003 www.BeaconLearningCenter.com 8 Rev. 07.23.03

