Stem and Leaf Plots
advertisement
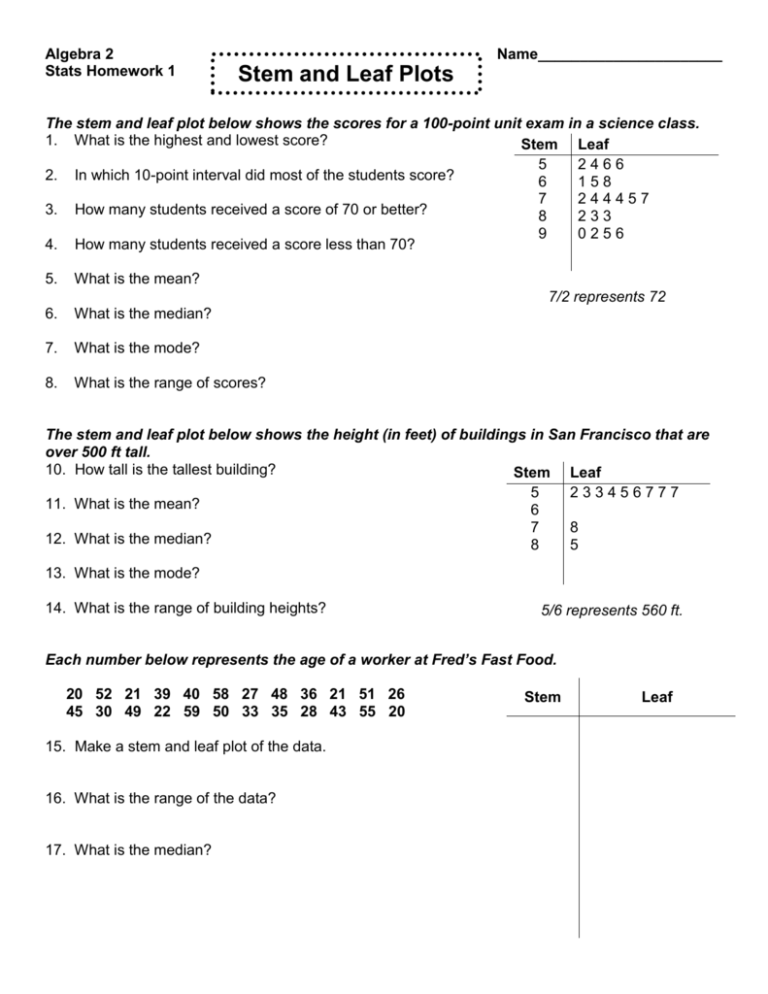
Algebra 2 Stats Homework 1 Name______________________ Stem and Leaf Plots The stem and leaf plot below shows the scores for a 100-point unit exam in a science class. 1. What is the highest and lowest score? Stem Leaf 2. In which 10-point interval did most of the students score? 3. How many students received a score of 70 or better? 4. How many students received a score less than 70? 5. What is the mean? 6. What is the median? 7. What is the mode? 8. What is the range of scores? 5 6 7 8 9 2466 158 244457 233 0256 7/2 represents 72 The stem and leaf plot below shows the height (in feet) of buildings in San Francisco that are over 500 ft tall. 10. How tall is the tallest building? Stem Leaf 5 233456777 11. What is the mean? 6 7 8 12. What is the median? 8 5 13. What is the mode? 14. What is the range of building heights? 5/6 represents 560 ft. Each number below represents the age of a worker at Fred’s Fast Food. 20 52 21 39 40 58 27 48 36 21 51 26 45 30 49 22 59 50 33 35 28 43 55 20 15. Make a stem and leaf plot of the data. 16. What is the range of the data? 17. What is the median? Stem Leaf Each number below represents round lots of XXYZ stock traded each day over a 28-day period. 814 722 144 413 812 118 214 533 219 254 183 733 624 121 325 166 722 766 814 723 325 445 388 239 357 746 537 155 Stem 18. Make a stem and leaf plot of the data. Leaf 19. What is the range? 20. What is the median? 21. What is the mean? 22. What is the mode? 23. How many times were more than 300 round lots of stock traded? Each number below represents the average SAT score for males and females for certain years between 1967 and 1989. 24. What is the median female score? Males Stem Females 25. What is the median male score? 26. What is the range of male scores? 9 8 4 6 5 4 2 27. What is the range of female scores? 28. What is the mean male score? 29. What is the mean female score? 8 7 86 87 88 90 91 92 93 94 95 96 97 3 4 2 5 7 8 0 6 5 87/5 represents 875

