M E 345 Professor John M. Cimbala Lecture 07
advertisement
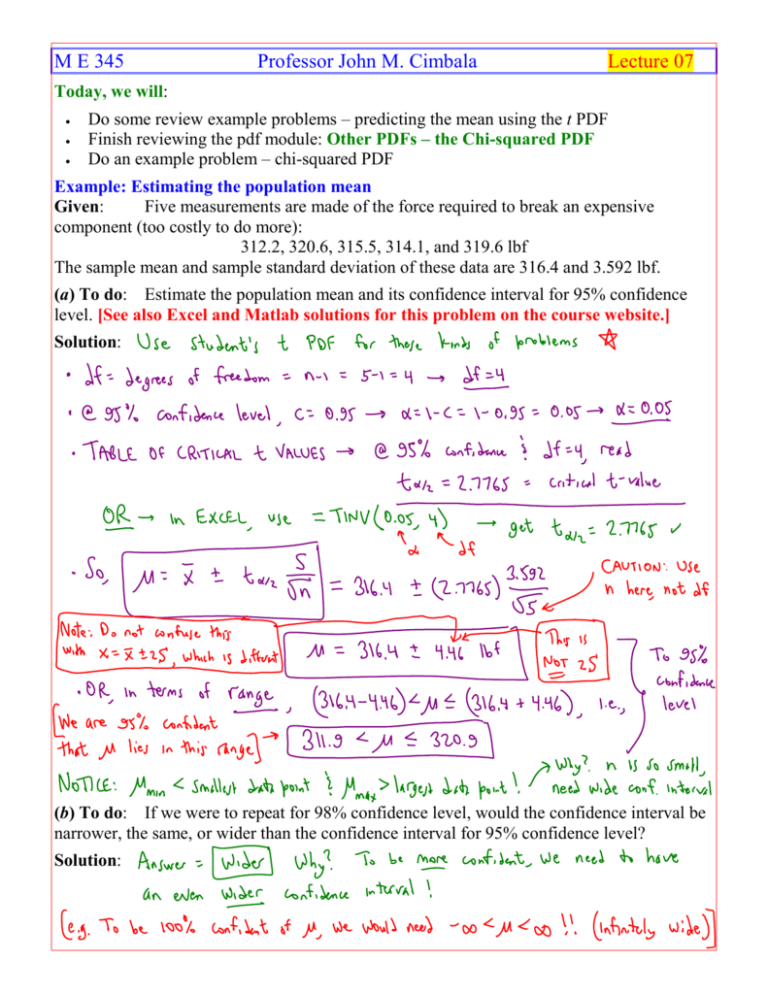
M E 345 Professor John M. Cimbala Lecture 07 Today, we will: • • • Do some review example problems – predicting the mean using the t PDF Finish reviewing the pdf module: Other PDFs – the Chi-squared PDF Do an example problem – chi-squared PDF Example: Estimating the population mean Given: Five measurements are made of the force required to break an expensive component (too costly to do more): 312.2, 320.6, 315.5, 314.1, and 319.6 lbf The sample mean and sample standard deviation of these data are 316.4 and 3.592 lbf. (a) To do: Estimate the population mean and its confidence interval for 95% confidence level. [See also Excel and Matlab solutions for this problem on the course website.] Solution: (b) To do: If we were to repeat for 98% confidence level, would the confidence interval be narrower, the same, or wider than the confidence interval for 95% confidence level? Solution: (c) To do: Estimate how many measurements would need to be taken to reduce the confidence interval to ±2.0 lbf [while maintaining a 95% confidence level]. Solution: Example: Estimating population mean and standard deviation Given: A quality control engineer pulls 10 resistors at random from an assembly line that makes 10-kΩ resistors, and measures each resistance. The measurements are given here: Measurement number 1 2 3 4 5 6 7 8 9 10 Resistance, kΩ 10.10 10.08 10.11 10.09 10.07 10.05 10.12 10.11 10.08 10.06 sample mean = 10.087 kΩ sample standard deviation = 0.02312 kΩ (a) To do: Estimate the population mean and its confidence interval for 95% confidence level. (b) To do: Estimate the population standard deviation and its confidence interval for 95% confidence level. (c) To do: The company guidelines specify that the population standard deviation be less than 0.35% of the mean to 98% confidence. Estimate how many additional resistors the quality control engineer needs to pull off the assembly line to measure. Solution:


