The Bottom Line - National Dropout Prevention Center
advertisement
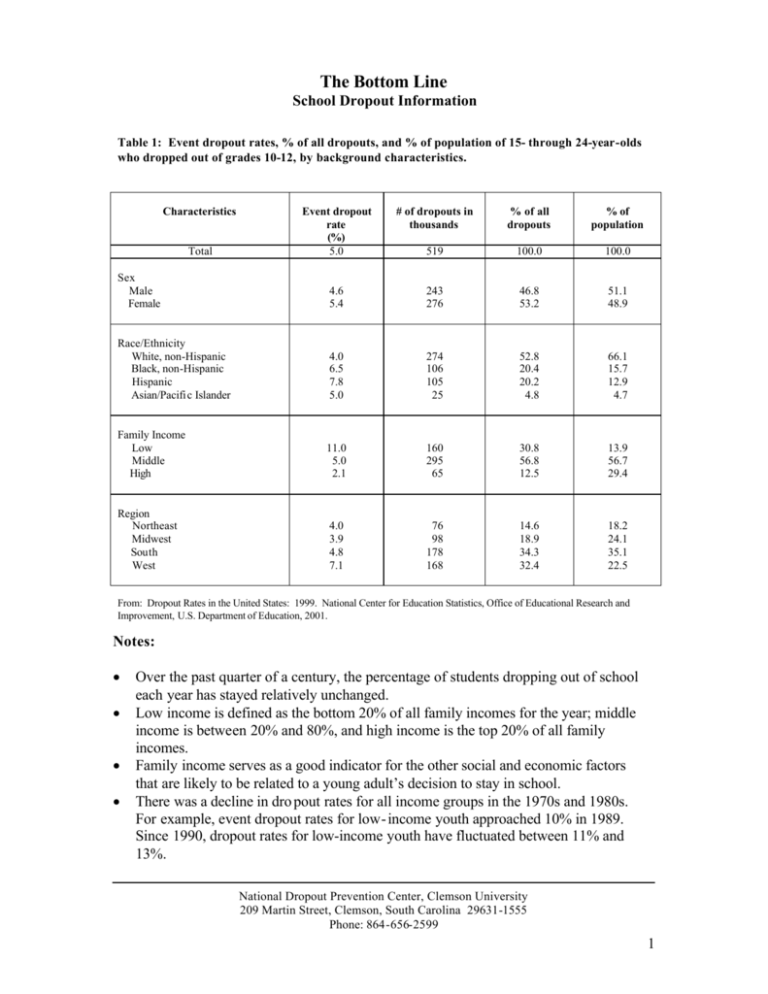
The Bottom Line School Dropout Information Table 1: Event dropout rates, % of all dropouts, and % of population of 15- through 24-year-olds who dropped out of grades 10-12, by background characteristics. Characteristics Event dropout rate (%) 5.0 # of dropouts in thousands % of all dropouts % of population 519 100.0 100.0 Sex Male Female 4.6 5.4 243 276 46.8 53.2 51.1 48.9 Race/Ethnicity White, non-Hispanic Black, non-Hispanic Hispanic Asian/Pacifi c Islander 4.0 6.5 7.8 5.0 274 106 105 25 52.8 20.4 20.2 4.8 66.1 15.7 12.9 4.7 Family Income Low Middle High 11.0 5.0 2.1 160 295 65 30.8 56.8 12.5 13.9 56.7 29.4 Region Northeast Midwest South West 4.0 3.9 4.8 7.1 76 98 178 168 14.6 18.9 34.3 32.4 18.2 24.1 35.1 22.5 Total From: Dropout Rates in the United States: 1999. National Center for Education Statistics, Office of Educational Research and Improvement, U.S. Department of Education, 2001. Notes: • • • • Over the past quarter of a century, the percentage of students dropping out of school each year has stayed relatively unchanged. Low income is defined as the bottom 20% of all family incomes for the year; middle income is between 20% and 80%, and high income is the top 20% of all family incomes. Family income serves as a good indicator for the other social and economic factors that are likely to be related to a young adult’s decision to stay in school. There was a decline in dro pout rates for all income groups in the 1970s and 1980s. For example, event dropout rates for low- income youth approached 10% in 1989. Since 1990, dropout rates for low-income youth have fluctuated between 11% and 13%. National Dropout Prevention Center, Clemson University 209 Martin Street, Clemson, South Carolina 29631-1555 Phone: 864-656-2599 1 Table 2—Percentage of 15- through 24-year olds who dropped out of grades 10-12 in the past year, percentage of 16- through 24-year olds who were dropouts, and percentage of 18- through 24-yearolds who completed high school by race/ethnicity: October 1999 Dropout and completion rates Total White, nonHispanic Black, nonHispanic Hispanic Asian/Pacific Islander 5.0 4.0 6.5 7.8 5.0 % of youth ages 16-24 who were dropouts in 1999 11.2 7.3 12.6 28.6 4.3 % of youth ages 18-24 who were high school completers in 1999 85.9 91.2 83.5 63.4 94.0 % of youth ages 15-24 who dropped out of grades 10-12, October 1998 to October 1999 From: Dropout Rates in the United States: 1999. National Center for Education Statistics, Office of Educational Research and Improvement, U.S. Department of Education, 2001. Method of High School Completion Approximately 76.8% of the 18- through 24- year-olds who were not enrolled in high school held regular diplomas (high school graduation rate). An additional 9.2% had completed high school by taking a high school equivalency test such as the GED. Economic Penalties for Dropping Out • High school dropouts are about three times as likely as those who have finished high school to slip into poverty from one year to the next. (Current population survey microdata. (1989-1998). U.S. Bureau of Labor Statistics.) • Five years after acquiring a GED with a score on the exam that was just passing, the average earnings of a 21- to 26- year-old white, non-Hispanic, adult was about $11,000 in 1995—less than the poverty level for a family of three that year. (Murnane, R. J., & Tyler, J. H. (May 3, 2000). The increasing role of the GED in American Education. Education Week on the Web. www.edweek.org) • Between 1973 and 1997, the average hourly wage (adjusted for inflation) of high school dropouts fell 31%. (Kids count data book. (2000). Annie E. Casey Foundatio n.) • Average annual earning by educational level: 1992-1993 High school dropout High school graduate, no college College graduate/Bachelor’s degree College graduate/Master’s degree $12,809 $18,737 $32,629 $48,635 (Education attainment in the Un ited States: March 1993 and 1992. U.S. Bureau of the Census, Current Population Reports, Washington, DC: U.S. Government Printing Office) 2 What Dropouts Say In 1990, tenth-grade dropouts were asked to identify the reasons they left school. The reasons they gave are listed below: Reasons Total Male Female School related: Did not like school Could not get along with teachers Could not get along with students Was suspended too often Did not feel safe at school Was expelled Felt I didn’t belong Could not keep up with school work Was failing school Changed school, didn’t like new one 51.2 35.0 20.1 16.1 12.1 13.4 23.2 31.3 39.9 13.2 57.8 51.6 18.3 19.2 11.5 17.6 31.5 37.6 46.2 10.8 44.2 17.2 21.9 12.7 12.8 8.9 14.4 24.7 33.1 15.8 Job related: Couldn’t work and go to school at same time Had to get a job Found a job 14.1 15.3 15.3 20.0 14.7 18.6 7.8 16.0 11.8 Family related: Had to support family Wanted to have family Was pregnant Became parent Got married Had to care for family member 9.2 6.2 31.0 13.6 13.1 8.3 4.8 4.2 ___ 5.1 3.4 4.6 14.0 8.4 31.0 22.6 23.6 12.2 Other: Wanted to travel Friends dropped out 2.1 14.1 2.5 16.8 1.7 11.3 (U.S. Department of Education, National Center for Education Statistics, National Education Longitudinal Study of 1988: First Follow-up Study, 1990.) Attendance and Truancy Poor attendance best predicts whether students will drop out. Dynarski, M., & Gleason, P. (1999). How can we help? Lessons from federal dropout prevention programs. Princeton, NJ: Mathematica Policy Research, Inc. Students who have been held back and are “over-age for grade” are most likely to be truant. Likewise, so are students misplaced in special education or enrolled in low-level classes. Wheelock, A. (2001). Fighting Truancy: What Works? What Doesn’t? SouthCoast Today (online). Available: www.s-t.com/daily. 3 Who's At Risk According to Wells (1990) these situations put youth at risk: School Related Student Related Conflict between home/school culture Poor School Attitude Ineffective discipline system Low ability level Lack of adequate counseling Attendance/truancy Negative school climate Behavior/discipline problems Lack of relevant curriculum Pregnancy Passive instructional strategies Drug Abuse Inappropriate use of technology Poor peer relationships Disregard of student learning styles Nonparticipation Retentions/Suspensions Friends have dropped out Low expectations Illness/disability Lack of language instruction Low self-esteem/self-efficacy Community Related Family Related Lack of community support services Low SES or response Dysfunctional home life Lack of community support for schools No parental involvement High incidences of criminal activities Low parental expectations Lack of school/community linkages Non-English-speaking home Ineffective parenting/abuse High mobility Duttweiler, P.C. (1995). Effective strategies for educating students at risk. Clemson SC: National Dropout Prevention Center. Behind the Data NDPC research and experience indicates that there are additional reasons why students drop out, including the following: • Lack of academic achievement • Community gang influences • School’s failure to meet students’ • Alcohol and drug abuse learning needs • Behavior and discipline problems • School attendance and discipline • Juvenile court policies • School’s failure to handle • Mental health issues discipline appropriately • Health problems and nutrition • Family criminal behavior/arrests • Abusive/disruptive home life Additional Resources National Dropout Prevention Center www.dropoutprevention.org National Institute on the Education of At -Risk Students www.ed.gov/offices/OERI/At-Risk Center for Researc h on the Education of Students Placed At Risk (CRESPAR) www.csos.jhu.edu/crespar 4
