Daily Call
advertisement
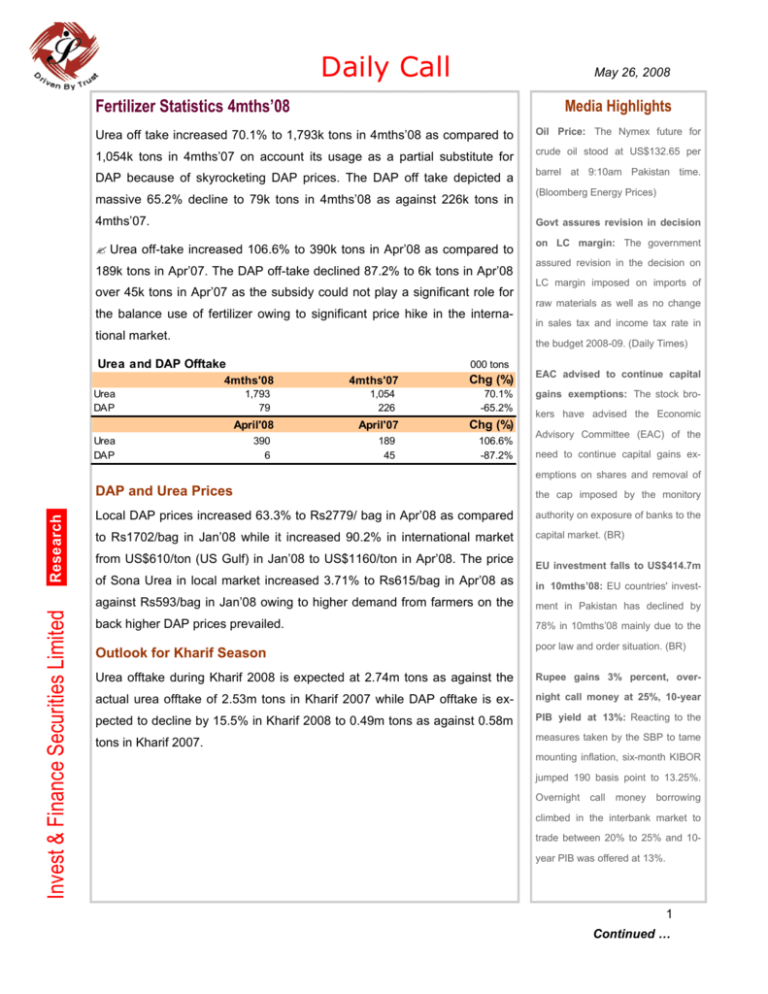
Daily Call May 26, 2008 Fertilizer Statistics 4mths’08 Media Highlights Urea off take increased 70.1% to 1,793k tons in 4mths’08 as compared to Oil Price: The Nymex future for 1,054k tons in 4mths’07 on account its usage as a partial substitute for crude oil stood at US$132.65 per DAP because of skyrocketing DAP prices. The DAP off take depicted a massive 65.2% decline to 79k tons in 4mths’08 as against 226k tons in barrel at 9:10am Pakistan time. (Bloomberg Energy Prices) 4mths’07. Govt assures revision in decision ? Urea off-take increased 106.6% to 390k tons in Apr’08 as compared to on LC margin: The government 189k tons in Apr’07. The DAP off-take declined 87.2% to 6k tons in Apr’08 over 45k tons in Apr’07 as the subsidy could not play a significant role for the balance use of fertilizer owing to significant price hike in the international market. assured revision in the decision on LC margin imposed on imports of raw materials as well as no change in sales tax and income tax rate in the budget 2008-09. (Daily Times) Urea and DAP Offtake 000 tons 4mths'08 Urea DAP 1,793 79 April'08 Urea DAP 390 6 4mths'07 1,054 226 April'07 189 45 Chg (%) EAC advised to continue capital 70.1% -65.2% gains exemptions: The stock bro- Chg (%) 106.6% -87.2% kers have advised the Economic Advisory Committee (EAC) of the need to continue capital gains ex- Invest & Finance Securities Limited Research emptions on shares and removal of DAP and Urea Prices the cap imposed by the monitory Local DAP prices increased 63.3% to Rs2779/ bag in Apr’08 as compared authority on exposure of banks to the to Rs1702/bag in Jan’08 while it increased 90.2% in international market capital market. (BR) from US$610/ton (US Gulf) in Jan’08 to US$1160/ton in Apr’08. The price EU investment falls to US$414.7m of Sona Urea in local market increased 3.71% to Rs615/bag in Apr’08 as in 10mths’08: EU countries' invest- against Rs593/bag in Jan’08 owing to higher demand from farmers on the ment in Pakistan has declined by back higher DAP prices prevailed. 78% in 10mths’08 mainly due to the Outlook for Kharif Season poor law and order situation. (BR) Urea offtake during Kharif 2008 is expected at 2.74m tons as against the Rupee gains 3% percent, over- actual urea offtake of 2.53m tons in Kharif 2007 while DAP offtake is ex- night call money at 25%, 10-year pected to decline by 15.5% in Kharif 2008 to 0.49m tons as against 0.58m PIB yield at 13%: Reacting to the tons in Kharif 2007. measures taken by the SBP to tame mounting inflation, six-month KIBOR jumped 190 basis point to 13.25%. Overnight call money borrowing climbed in the interbank market to trade between 20% to 25% and 10year PIB was offered at 13%. 1 Continued … Market Statistics KSE Statistics Market Capt. 23-May-08 US$57.79b KSE-100 Index Rs 4004.25b 9.9% 12 m 13,011.7 Amount (Rs b) Last Closing 13,627.0 Volume (m) (615.3) Average Rate 17.84% Chg % -4.52% CFS MK-II Rate Top 5 CFS Stocks (last day) 15.59% -4.8% 12 mths Chg % 4.1% NBP 5.6b, 17.7% POL 5.1b, 17.3% 15,676.3 AHSL 4.2b, 18.3% 12 mths Low 11,141.9 PPL 3.3b, 17.5% Total 2.4b, 17.5% Futures 154.8 Open Int. (Rs b) 22.85 27.8 Open Int. Last day (Rs.b) 23.75 182.5 Total Open Int. (m sh) 171.87 Future Spread 19.91% YTD Average 240.7 Top Gainers Top Losers 12 mths Average 262.4 - NICL (- 15.2%) - DSFL (- 14.8%) 12 mths High 524.6 - OIBL (- 14.1%) 12 mths Low 59.1 - TRG (- 13.6%) Global Markets Index DOW JONES NIKKIE-225 DAX FTSE-100 CAC-40 SSEC SMSI SENSEX KS11 IPC AORD BVSP RTS OXMS Hang Seng Strait Times KLSE MERVAL CCSI YTD Flow (52.11) FY'07 Flow 978.23 6 months Kibor 13.80% 10.17% Top Inflows USA 14.00% Amount (b), Rate 12 mths High Futures 13.74% 9.82% 12 months Kibor YTD Chg % Trading Volume 3 months Kibor 381.62 13,985.1 ENGRO SCRA Position (m US$) C u rre n t May'07 44.47 Chg Ready Interest Rates Continuous Funding System Current Closing 12 mths Average Other Domestic Market Indicators 10.51% 3 years PIB 401.96 Kuwait 43.13 Luxembourg 23.37 11.95% 9.63% Camyan Island 12.35% 9.73% Top Outflows 6.10 5 years PIB 10 years PIB UK (344.75) Australia (66.98) Exchange Rates Important Board Meetings May'07 C h g % Al-Noor Sugar 26-May-08 Current 12.75% 10.05% US Dollar 68.44 60.72 12.71% Euro 107.61 82.47 30.48% Yen 0.66 0.51 29.41% Yuan 10.00 7.93 26.10% Thal Ind. Corp. 26-May-08 Current Last 12 mths Chg Chg Commodities Origin New York Tokyo Frankfurt London Paris Shanghai Madrid Mumbai Current 4,395.0 14,012.2 6,944.1 6,087.3 4,933.8 3,473.1 1,459.2 16,649.6 Last 12 mths Chg Chg -1.6% -4.5% 0.2% -20.9% -1.8% -10.2% -1.5% -8.0% -1.9% -19.4% -0.4% -16.8% -2.9% -13.0% -1.5% 15.9% Seoul Mexico Sydney São Paulo Moscow Stockholm Hong Kong Singapore Kuala Lumpur Buenos Aires Cairo 1,459.2 31,068.7 5,866.2 71,452.0 2,435.2 322.2 24,714.1 3,122.2 1,274.8 2,235.3 3,539.3 -1.8% -0.6% -0.9% -1.2% 0.1% -1.9% -1.3% -1.2% -0.2% -0.6% 0.7% -11.4% 0.6% -7.9% 37.9% 34.1% -22.9% 18.8% -12.3% -5.9% 1.8% 34.2% Inde x Origin Gold London Silver London Copper London Oil OPEC Basket Natural Gas Nymex Coal South Africa Wheat India Sugar India Cotton Karachi Urea Black Sea 922.25 1,810.00 8,350.00 127.59 11.86 108.58 1,112.85 1,448.10 3,600.00 643.00 -0.6% 1.6% 0.0% 2.5% 1.9% -4.4% 0.0% 0.0% 3.6% 2.9% 39.9% 39.7% 15.7% 91.9% 61.3% 110.8% 20.2% 13.5% 35.8% 118.0% Invest & Finance Securities Limited 12th Floor, Corporate Towers, Technocity Building, Hasrat Mohani Road, Off. I.I. Chundrigar Road. Karachi. Tel: 9221- 2276932-35 Fax: 9221- 2276969 website: www.investfinance.com.pk 2 Disclaimer: This report is for information purposes only and we are not soliciting any action based upon it. The material is based on information we believe to be reliable but we do not guarantee that it is accurate and complete. Invest & Finance Securities Ltd. will not be responsible for the consequence of reliance upon any opinion or statement herein or for any omission.
