Comparative Product Lifecycle Assessment
advertisement
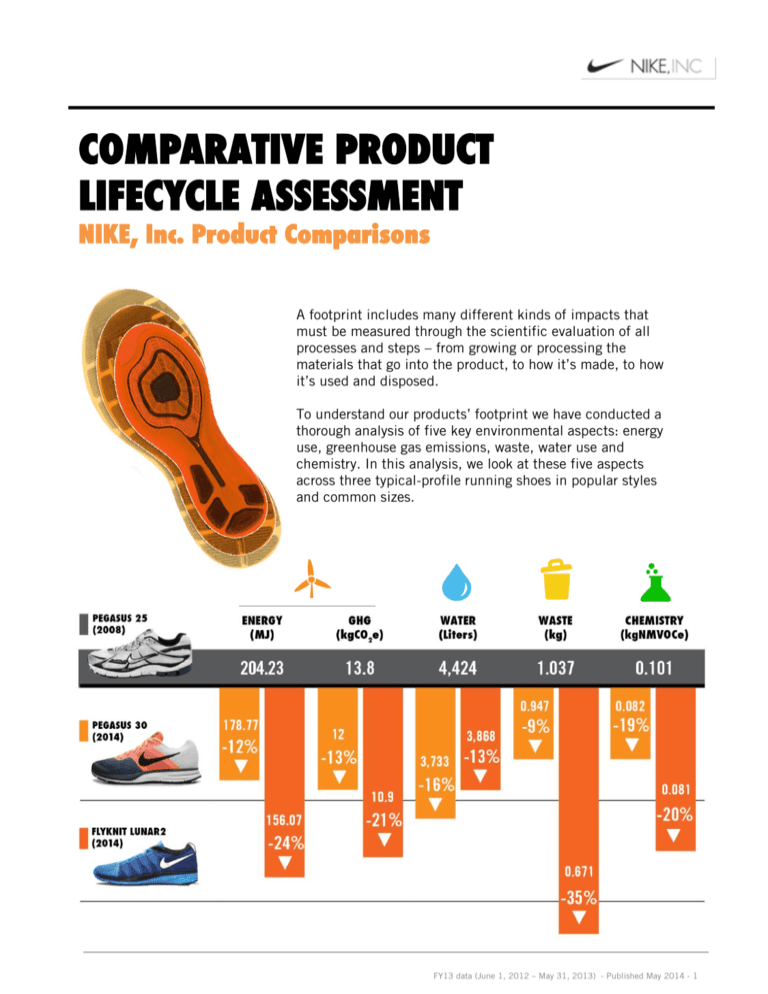
COMPARATIVE PRODUCT LIFECYCLE ASSESSMENT NIKE, Inc. Product Comparisons A footprint includes many different kinds of impacts that must be measured through the scientific evaluation of all processes and steps – from growing or processing the materials that go into the product, to how it’s made, to how it’s used and disposed. To understand our products’ footprint we have conducted a thorough analysis of five key environmental aspects: energy use, greenhouse gas emissions, waste, water use and chemistry. In this analysis, we look at these five aspects across three typical-profile running shoes in popular styles and common sizes. FY13 data (June 1, 2012 – May 31, 2013) - Published May 2014 - 1 METHODOLOGY: PRODUCT LIFECYCLE ASSESSMENT What’s the total impact of a product? There’s no simple calculation. To fully understand the footprint of a product, we need to take into account the materials used (how they’re made and processed), manufacturing methods (including six or more individual steps), how materials and products are moved from processing to factory to distribution center then to retail, as well as the sales infrastructure, the impact at use, and what’s left when the product’s useful life is over. Our work today does not cover all of the environmental impacts potentially included in a lifecycle assessment – that could stretch to well over a dozen different impacts – but quantifying these four does provide important insights OVERALL • • • • ENERGY and CARBON EMISSIONS – The production of the materials used in a running shoe (which we assess at the Design phase) drives the most energy use and greenhouse gas emissions throughout the life cycle. The single most important driver is therefore the amount of materials used, which in turn is driven by the weight of the style and the efficiency of the pattern. The biggest contributing materials are polyester fabric, EVA foam midsole, polyurethane (PU) and rubber. WASTE – Flyknit reduces waste overall through advanced manufacturing processes and the light weight of the shoe. WATER – Impacts are comparable for all three styles, mostly due to indirect water use from electricity generation. (Note that water use is defined here as total water withdrawn, whether it is returned or not to the watershed. This is different from consumptive use, which would only account for water withdrawn not returned to the watershed.) CHEMISTRY (measure of petroleum-derived solvents, or NMVOCe) - Around half of emissions are from Make phase, 30% from Materials (Design) and 20% from Move. Significant reduction achieved through substitution of water-based substances for cleaning, priming and cementing. WHY We used a lifecycle approach to compare the footprints of three NIKE performance running models to assess changes resulting from design/materials choices and manufacturing decisions and processes. This provides a point-in-time comparison of all inputs and a lens into the full impact of a product. Coupled with full value chain assessments of our footprint, this product-level view helps to identify the phases with the greatest impacts, where changes have delivered results, and where further work is needed. • • In 2008, NIKE published an energy and carbon footprint of the Air Pegasus 25. This work provided new insight into the footprint of a product. (http://www.nikebiz.com/crreport/content/environment/4-3-2-highlights-of-ourwork.php?cat=climate-and-energy) In 2014, we update the footprint with additional data to evaluate water use and waste, provide a basis for comparison with other styles, and update the assumptions and data in our previous assessment, as more accurate information on manufacturing processes, emissions factors, materials impacts and other data have become available. FY13 data (June 1, 2012 – May 31, 2013) - Published May 2014 - 2 METHODOLOGY: ABOUT OUR APPROACH HOW We worked with all available data, including primary data collected by NIKE and publicly available life cycle inventory data about materials and processes. The scope of this work included evaluating every step of the life cycle we could identify, broken into the seven simplified steps of our value chain (Plan, Design (Materials), Make, Move, Sell, Use, End of Life. We assessed to the specific product level using a typical men’s sample size. We compared running shoes of the same size, comparable styles, and the same durability requirements. The actual footprint of any specific product would be driven by a range of factors, including its size, color, etc. We assessed the following key inventories and impact categories: • Primary energy demand (in kWh) • Climate Change (in kg CO2e) - using the Intergovernmental Panel on Climate Change (IPCC) methodology: “IPCC global warming, excluding biogenic carbon” • Water use (in L) • Waste generated (in kg) • Chemistry (Smog (kg NMVOCe)): Photochemical ozone formation, LOTOS-EUROS model, ReCiPe REVIEWS – We reviewed models and outputs with a life cycle assessment expert to test the soundness of the approach, data sources, assumptions and overall results. While we included elements of the ISO 14040-44 standards in our approach, this review was not a complete critical review as defined by that standard. BOUNDARIES – At each phase we have included relevant steps as described in the diagram below. FY13 data (June 1, 2012 – May 31, 2013) - Published May 2014 - 3 RESULTS: PRODUCT LIFECYCLE ASSESSMENT Air Pegasus 25 (2008) Popular style of running shoe, typical of the range of available styles. More than 50 component parts. A previous analysis carried out in 2008 based on available information on inputs, process steps and emissions factors, but underestimated energy use and over-estimated emissions. The analysis was updated using new information in 2014. Air Pegasus 30 (2014) Five years later, Air Pegasus was still a popular style. Due to updates in design, it was lighter weight, used fewer materials and was less water, energy and chemically intensive. Flyknit Lunar2 (2014) Game-changing design in a popular style. Different platform from the Pegasus, so the midsole and outsole contain some different components and processes. Changes in materials and manufacturing methods deliver considerable reductions in impacts over previous designs. IMPACT MEASURE SHOE TOTAL VALUE CHAIN PHASES PLAN DESIGN MAKE MOVE SELL USE END OF LIFE (MATERIALS) ENERGY GHG WATER WASTE CHEMISTRY MJ kgCO2e Liters Kg kgNMVOCe 204.23 4.32 128.34 48.72 20.83 3.94 0.08 -2.00 178.77 4.32 113.32 38.14 20.83 3.94 0.08 -1.85 156.07 4.32 88.62 39.67 20.83 3.94 0.08 -1.39 13.76 0.27 7.26 4.07 1.53 0.31 0.14 0.18 11.96 0.27 6.35 3.18 1.53 0.31 0.14 0.17 10.88 0.27 5.20 3.31 1.53 0.31 0.14 0.12 4424.42 161.42 1868.26 2113.04 104.21 150.66 3.24 21.83 3733.33 161.42 1636.52 1655.45 104.21 150.66 3.24 21.83 3867.92 161.42 1730.04 1701.99 104.21 150.66 3.24 16.36 1.04 0.01 0.07 0.26 0.03 0.01 0.06 0.59 0.95 0.01 0.06 0.22 0.03 0.02 0.06 0.54 0.67 0.01 0.305 0.09 0.03 0.02 0.06 0.41 0.101 0.000 0.031 0.053 0.016 0.000 0.000 0.000 0.082 0.000 0.027 0.038 0.016 0.000 0.000 0.000 0.081 0.000 0.024 0.039 0.016 0.000 0.000 0.000 FY13 data (June 1, 2012 – May 31, 2013) - Published May 2014 - 4 METHODOLOGY: PRODUCT LIFECYCLE ASSESSMENT STAGE PLAN DESIGN (Materials) MAKE DATA SOURCES QUALITY OF DATA STEPS EXCLUDED • NIKE primary data • US EPA eGRID • US EPA Municipal Solid Waste report High Employee commuting • NIKE Material Sustainability Index (which has been third-party reviewed and is the basis for industry-wide index) • PlasticsEurope • PE International’s GaBi LCA databases • International Energy Agency • European Federation of Corrugated Board Manufacturers (FEFCO) • U.S. Life Cycle Inventory database • Van der Velden, Patel, Vogtlander, Lifecycle analysis benchmarking study on textiles made of cotton, polyester, nylon, acryl, or elastane, 2012 Medium • • • NIKE primary data for energy, water and waste, based on direct measurements at contract factories International Energy Agency PE International’s GaBi LCA databases Mediumhigh • • • High • NIKE primary data for transportation modes, distances, loads, and distribution center impacts PE International’s GaBi LCA databases SELL • • • NIKE primary data US EPA eGRID US EPA Municipal Solid Waste report High USE • • • NIKE primary data US EPA eGRID US EPA Municipal Solid Waste report Mediumhigh END OF LIFE (REUSE) • • PE International’s GaBi LCA databases US EPA Municipal Solid Waste report Mediumhigh MOVE • Tooling processes (e.g., making of midsole and outsole molds) which is considered very minor on a per-pair basis . Waste that is not material loss from pattern inefficiency (e.g., containers, rags, etc.). Byproducts in the shoe’s manufacturing process. Though some scraps can be sold for down-cycling, no impacts have been allocated to these scraps Product maintenance (washing/drying) because it is uncommon for performance running shoes FY13 data (June 1, 2012 – May 31, 2013) - Published May 2014 - 5 METHODOLOGY: External reviews THIRD-PARTY REVIEW NIKE, Inc. performed a life cycle assessment (LCA) to compare the environmental footprints of three NIKE performance running models: the Air Pegasus 25 (2008), the Air Pegasus 30 and Flyknit Lunar 2 (both 2014). NIKE submitted the LCA to an independent expert, B. M. Krishna Manda, of Sustainable Value Consultancy, for review of the methodology, overall modeling approach, data sources and data quality. The LCA and review have included elements of the ISO 14040-44 standards, however this review was not a complete critical review as defined by that standard. “The Nike approach duly considers the key elements of the LCA methodology, including the equivalence of the products’ function, product systems and methodological considerations, such as system boundary, data quality, allocation procedures, and decision rules for evaluating inputs, outputs and impacts. The modeling has comprehensively captured the attributes relevant to the product systems of three footwear models and collected the necessary data for the plan, design, make, move, sell, use and end-of-life stages. As such, the LCA performed supports its intended purpose as a comparative analysis of the design improvements of Nike footwear models over the last few years.” -B. M. Krishna Manda, Sustainable Value Consultancy, Netherlands FURTHER OPPORTUNITIES The review also identified opportunities for improvement, including: • Expand primary data collection in the supply chain. Due to the relative significance of a few finished materials in the final results (i.e, the proportion of impact from materials in the design stage), improved collection and review of primary data for key materials (e.g., polyester fabric) would further improve the accuracy of the results. • Broaden the scope of environmental impacts assessed. The current project assessed a limited number of aspects. Recognizing that finished material production and footwear manufacturing are generally located in developing countries, it is advised to include impact categories relevant to these geographies, such as eutrophication, particulate matter formation, toxicity, and fossil depletion. • Perform further sensitivity and uncertainty analyses: To improve representativeness and robustness of the results, additional sensitivity analyses on key parameters and assumptions and an uncertainty analysis should be conducted. FY13 data (June 1, 2012 – May 31, 2013) - Published May 2014 - 6
