Fig - The Association for the Study of Peak Oil and Gas
advertisement

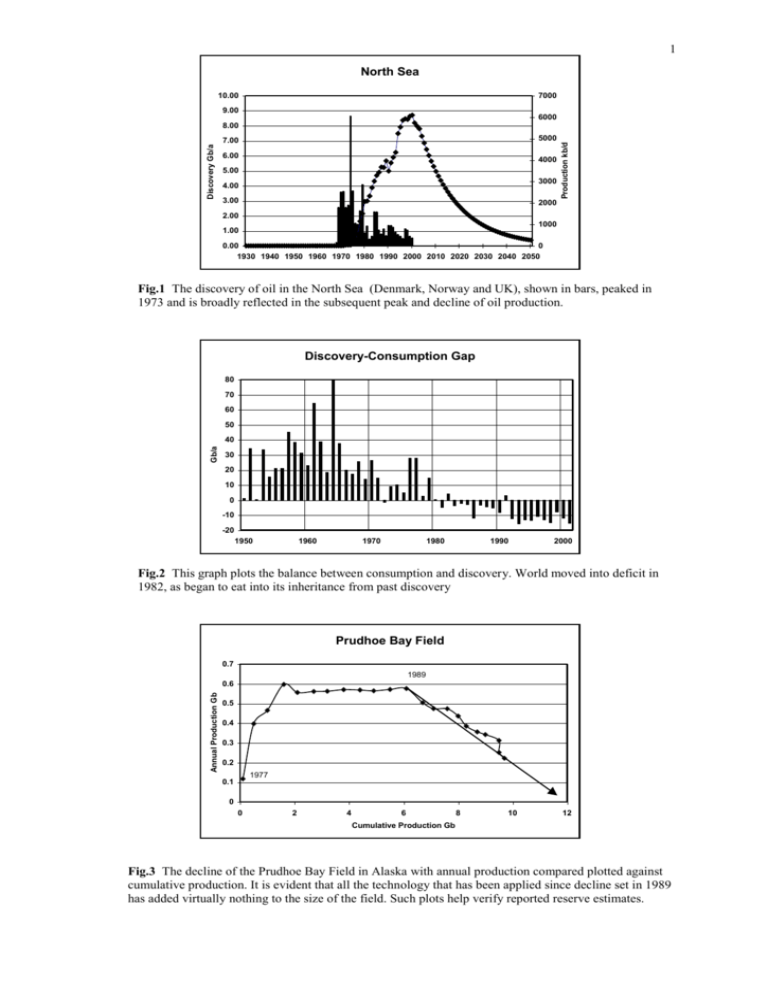
1 North Sea 10.00 7000 9.00 6000 5000 7.00 6.00 4000 5.00 3000 4.00 3.00 Production kb/d Discovery Gb/a 8.00 2000 2.00 1000 1.00 0.00 0 1930 1940 1950 1960 1970 1980 1990 2000 2010 2020 2030 2040 2050 Fig.1 The discovery of oil in the North Sea (Denmark, Norway and UK), shown in bars, peaked in 1973 and is broadly reflected in the subsequent peak and decline of oil production. Discovery-Consumption Gap 80 70 60 50 Gb/a 40 30 20 10 0 -10 -20 1950 1960 1970 1980 1990 2000 Fig.2 This graph plots the balance between consumption and discovery. World moved into deficit in 1982, as began to eat into its inheritance from past discovery Prudhoe Bay Field 0.7 1989 Annual Production Gb 0.6 0.5 0.4 0.3 0.2 1977 0.1 0 0 2 4 6 8 10 12 Cumulative Production Gb Fig.3 The decline of the Prudhoe Bay Field in Alaska with annual production compared plotted against cumulative production. It is evident that all the technology that has been applied since decline set in 1989 has added virtually nothing to the size of the field. Such plots help verify reported reserve estimates. 2 N.Sea Creaming Curve Norway, UK & Denmark 70 Cum. Discovery Gb 60 2001 50 1981 40 30 20 10 0 0 500 1000 1500 2000 2500 3000 3500 4000 4500 5000 Cum. Wildcats Fig. 4 Cumulative discovery plotted against exploration boreholes, which are responsible for discoveries. The larger fields are found first, being too large to miss, giving a hyperbolic trajectory that can be extrapolated to show what is left to find. Parabolic Fractal 4 3.5 Log Size 3 2.5 2 1.5 1 0.5 0 1 10 100 1000 Rank Present Size Distribution Parabolic Distribution Fig. 5 Actual field size distribution plotted against rank (largest, second largest, third largest……) on a log-log scale, and compared with a parabolic model. World 45 40 Production Gb 35 30 25 20 15 10 5 0 1930 1950 1970 1990 2010 Hubbert Actual & Forecast 2030 2050 Fig. 6 Actual world production compared with the theoretical “Hubbert” bell-curve of unfettered depletion. There was a close fit until the oil shocks of the 1970s curbed demand, leading to a lower and later actual peak. 3 All Hydrocarbons 50 Non-Con Gas 45 Gas 40 NGL Gboe 35 Polar 30 Deepwater 25 Heavy 20 Conventional 15 10 5 0 1930 1940 1950 1960 1970 1980 1990 2000 2010 2020 2030 2040 2050 Fig. 7 Forecast production of all hydrocarbons, based on assessed resource and extraction rate (Gas is converted to oil equivalent on a value bases of 10 Tcf = 1 Gboe). USA Production kb/d 10000 9000 Deepwater 8000 Alaska 7000 Conventional 6000 5000 4000 3000 2000 1000 0 1930 1940 1950 1960 1970 1980 1990 2000 2010 2020 2030 2040 2050 Fig. 8. Oil depletion profile of the United States, including Non-conventional deepwater and polar oil Russia 12000 Non-Conventional 10000 Production kb/d Conventional 8000 6000 4000 2000 0 1930 1940 1950 1960 1970 1980 1990 2000 2010 2020 2030 2040 2050 F ig. 9 Oil depletion profile of Russia, showing the saddle due to the collapse of the Communist regime, and the possible addition of polar Non-conventional, which awaits confirmation. . 4 India 3 800 700 600 2 500 2 400 300 1 Production kb/d Disciovery Gb (bars) 3 200 1 100 0 0 1930 1940 1950 1960 1970 1980 1990 2000 2010 2020 2030 2040 2050 Fig. 10 Oil depletion profile of India, showing discovery in bars 5 1800 5 1600 4 1400 4 1200 3 1000 3 800 2 600 2 1 400 1 200 Production k/bd Discovery Gb (bars) Indonesia 0 0 1930 1940 1950 1960 1970 1980 1990 2000 2010 2020 2030 2040 2050 Fig. 11 Oil depletion profile of Indonesia showing two cycles of discovery and corresponding production 16 4000 14 3500 12 3000 10 2500 8 2000 6 1500 4 1000 2 500 Production kb/d Discovery Gb (bars) China 0 0 1930 1940 1950 1960 1970 1980 1990 2000 2010 2020 2030 2040 2050 Fig 12 Oil depletion profile of China, showing how the early peak of discovery is to be mirrored by production. 5 Middle East Creaming Curve 800 Cum. Discovery Gb 700 600 500 400 300 200 100 0 0 200 400 600 800 1000 1200 1400 1600 Cum. Wildcats Fig. 13 Middle East “creaming curve” showing confirming that it is a concentrated geological habitat with most of its oil in a few very large fields. The discovery trend shows that what remains to be found is less by orders of magnitude. . Middle East Swing Production 10000 9000 Production kb/d 8000 7000 6000 5000 4000 3000 2000 1000 0 1970 1980 1990 2000 2010 Abu Dhabi Iran Iraq Neutral Zone Saudi Arabia Kuwait 2020 Fig. 14. Production from the five Middle East Swing countries, indicating the demands made upon them under the base case scenario of flat world demand to 2010 as modelled


