Lab 1
advertisement

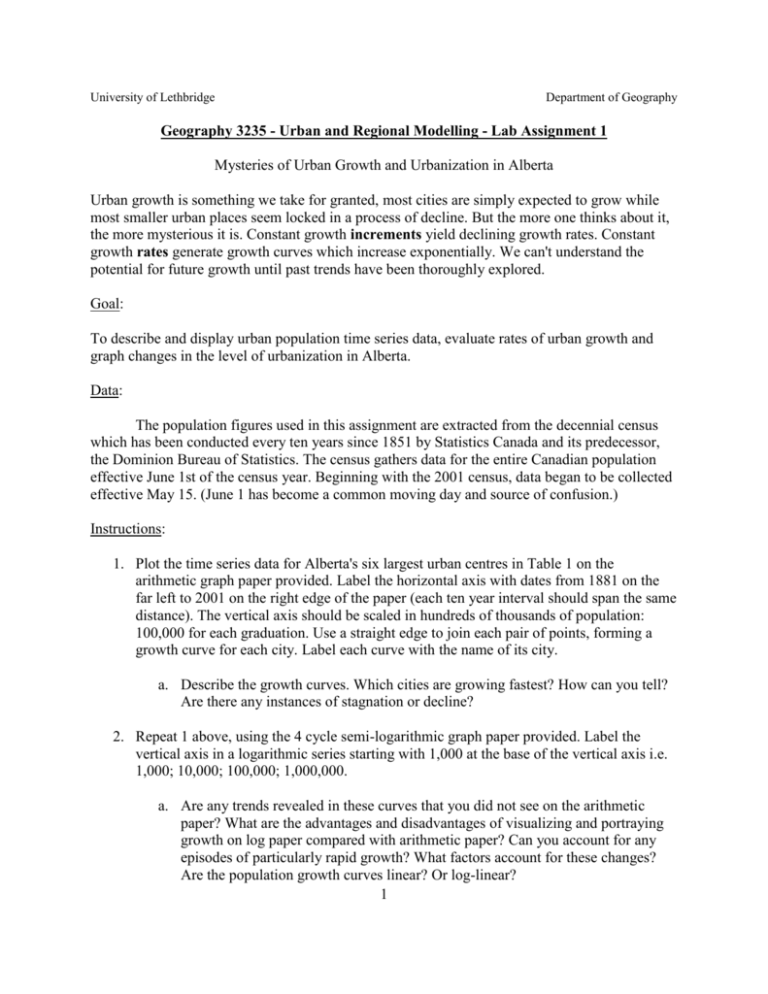
University of Lethbridge Department of Geography Geography 3235 - Urban and Regional Modelling - Lab Assignment 1 Mysteries of Urban Growth and Urbanization in Alberta Urban growth is something we take for granted, most cities are simply expected to grow while most smaller urban places seem locked in a process of decline. But the more one thinks about it, the more mysterious it is. Constant growth increments yield declining growth rates. Constant growth rates generate growth curves which increase exponentially. We can't understand the potential for future growth until past trends have been thoroughly explored. Goal: To describe and display urban population time series data, evaluate rates of urban growth and graph changes in the level of urbanization in Alberta. Data: The population figures used in this assignment are extracted from the decennial census which has been conducted every ten years since 1851 by Statistics Canada and its predecessor, the Dominion Bureau of Statistics. The census gathers data for the entire Canadian population effective June 1st of the census year. Beginning with the 2001 census, data began to be collected effective May 15. (June 1 has become a common moving day and source of confusion.) Instructions: 1. Plot the time series data for Alberta's six largest urban centres in Table 1 on the arithmetic graph paper provided. Label the horizontal axis with dates from 1881 on the far left to 2001 on the right edge of the paper (each ten year interval should span the same distance). The vertical axis should be scaled in hundreds of thousands of population: 100,000 for each graduation. Use a straight edge to join each pair of points, forming a growth curve for each city. Label each curve with the name of its city. a. Describe the growth curves. Which cities are growing fastest? How can you tell? Are there any instances of stagnation or decline? 2. Repeat 1 above, using the 4 cycle semi-logarithmic graph paper provided. Label the vertical axis in a logarithmic series starting with 1,000 at the base of the vertical axis i.e. 1,000; 10,000; 100,000; 1,000,000. a. Are any trends revealed in these curves that you did not see on the arithmetic paper? What are the advantages and disadvantages of visualizing and portraying growth on log paper compared with arithmetic paper? Can you account for any episodes of particularly rapid growth? What factors account for these changes? Are the population growth curves linear? Or log-linear? 1 University of Lethbridge Department of Geography 3. Repeat 1 above, using Microsoft Excel to enter the time series: i. Graph the series as entered using an arithmetic scale for the y axis. ii. Graph the series as entered using a logarithmic scale for the y axis. iii. Compute log10 of the population data on a new sheet. Graph the series using an arithmetic scale. b. Compare your hand drawn work with the Excel output. What are the advantages and disadvantages of computer graphics? 4. For the Calgary CMA, compute intercensal growth increments and growth rates. Display your results as a table. a. Explain how increments and growth rates are different. How do they relate to the arithmetic and logarithmic series that you have graphed? 5. Compute the level of urbanization in Alberta for each time period from 1901 to 2001. Graph Alberta's level of urbanization over time using an area graph and print it. a. Is Alberta urbanized? Compare past and contemporary rates of urbanization. Does further urbanization appear likely? 6. Why is Lethbridge so much smaller than Calgary and Edmonton? Several hypotheses suggest themselves. a. Calgary and Edmonton were established earlier and gained an important early size advantage that Lethbridge could never overcome. (We could call this the runt of the litter hypothesis.) b. Calgary and Edmonton have benefited from superior strategic locations throughout their growth histories and accordingly, they grew faster than Lethbridge as they gained in population, power, and influence. Answer this question and evaluate the hypotheses, making reference to the tables and graphs you created above. Your laboratory report should be typed with a cover sheet and submitted on September 22, 2004. Following the format used in your textbook and using the Guide to Term Papers on the course web page note that graphs and tables should be numbered with titles, axis labels, and a source to indicate where you obtained the data. 2 University of Lethbridge Department of Geography Table 1: Census Population for Urban Centres in Alberta Year 1881 1891 1901 1911 1921 1931 1941 1951 1961 1971 1981 1991 1996 2001 263 700 2,626 31,064 58,821 79,187 93,817 159,631 281,027 495,702 740,882 841,132 862,597 937,845 100 3,867 4,398 43,704 63,305 83,761 88,904 129,060 249,641 403,319 625,966 754,033 821,628 951,395 4 1,478 2,072 8,050 11,907 13,489 14,612 22,947 35,454 41,217 54,072 60,974 63,054 67,374 Red Deer n/a 50 323 2,118 2,328 2,344 2,924 7,575 19,612 27,674 46,393 58,145 60,075 67,707 Medicine Hatd n/a 1,570 3,020 5,608 9,634 10,300 10,571 16,364 24,484 28,773 40,380 52,681 56,570 61,735 Fort McMurrayc n/a n/a n/a n/a n/a n/a n/a n/a 1,186 6,907 31,000 36,771 35,213 41,466 Urban Albertaf n/a n/a 12,000 109,936 177,170 227,882 266,000 450,000 851,576 1,196,255 1,727,545 2,030,893 2,142,815 2,374,610 Rural Alberta n/a n/a 61,000 264,359 411,284 503,723 531,000 489,000 480,368 431,620 510,179 514,660 554,011 566,535 Edmonton CMAa Calgary CMAb Lethbridge Notes: a. Edmonton CMA includes Fort Saskatchewan, Leduc, St. Albert, Spruce Grove, Sturgeon, Strathcona County, etc. Data from 1911 to 1951 were rounded to the nearest thousand. Prior to 1961, data are for the Edmonton municipality. b. Calgary CMA includes Airdrie, Beiseker, Chestermere Lake, Cochrane, Crossfield, Irricana, Rocky View, and Sonu I.R. Data from 1911 to 1951 were rounded to the nearest thousand. Prior to 1961, data are for the Calgary municipality. c. Population is for Fort McMurray until 1981, Special Municipality of Wood Buffalo in 1991 and 1996. d. Population for Medicine Hat CA includes Cyprus MD, Irvine and Redcliff. e. N/A indicates data not available, the centre was smaller than 1,000. f. Urban is defined as any centre in excess of 1,000 population. Source: Statistics Canada, Census of Canada, Various years. 3


