Economics 302
advertisement

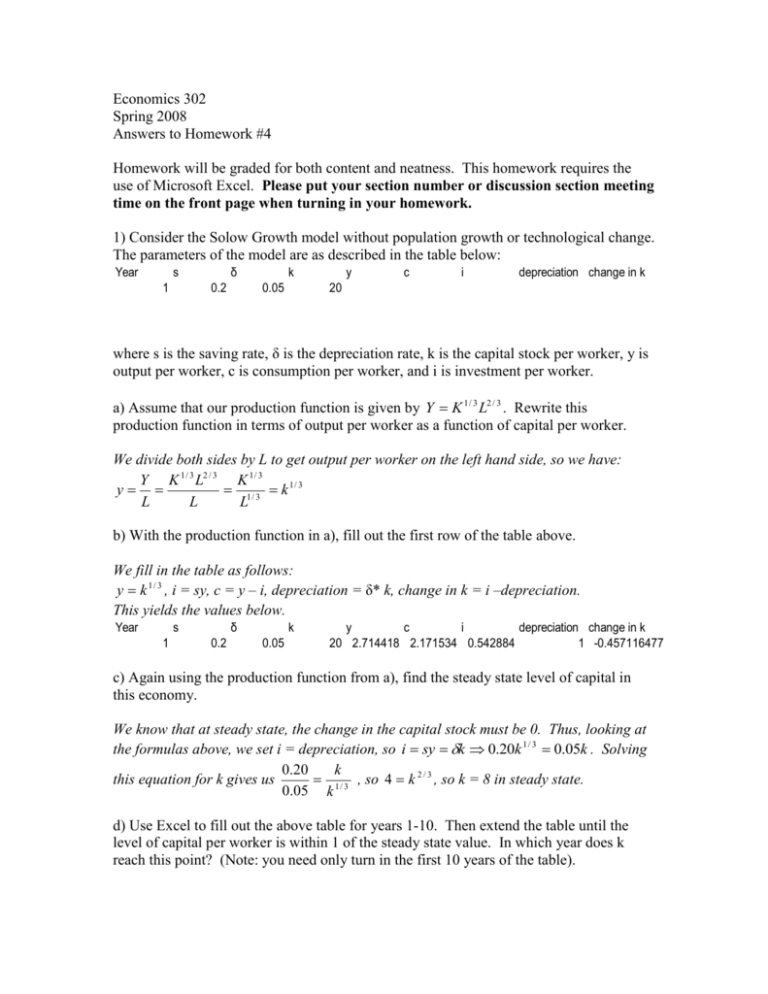
Economics 302 Spring 2008 Answers to Homework #4 Homework will be graded for both content and neatness. This homework requires the use of Microsoft Excel. Please put your section number or discussion section meeting time on the front page when turning in your homework. 1) Consider the Solow Growth model without population growth or technological change. The parameters of the model are as described in the table below: Year δ s 1 0.2 k 0.05 y c i depreciation change in k 20 where s is the saving rate, δ is the depreciation rate, k is the capital stock per worker, y is output per worker, c is consumption per worker, and i is investment per worker. a) Assume that our production function is given by Y K 1 / 3 L2 / 3 . Rewrite this production function in terms of output per worker as a function of capital per worker. We divide both sides by L to get output per worker on the left hand side, so we have: Y K 1 / 3 L2 / 3 K 1 / 3 y 1/ 3 k 1/ 3 L L L b) With the production function in a), fill out the first row of the table above. We fill in the table as follows: y k 1 / 3 , i = sy, c = y – i, depreciation = δ* k, change in k = i –depreciation. This yields the values below. Year δ s 1 0.2 k 0.05 y c i depreciation change in k 20 2.714418 2.171534 0.542884 1 -0.457116477 c) Again using the production function from a), find the steady state level of capital in this economy. We know that at steady state, the change in the capital stock must be 0. Thus, looking at the formulas above, we set i = depreciation, so i sy k 0.20k 1 / 3 0.05k . Solving 0.20 k 1 / 3 , so 4 k 2 / 3 , so k = 8 in steady state. this equation for k gives us 0.05 k d) Use Excel to fill out the above table for years 1-10. Then extend the table until the level of capital per worker is within 1 of the steady state value. In which year does k reach this point? (Note: you need only turn in the first 10 years of the table). Using Excel, we get a table as below: Year δ s 1 2 3 4 5 6 7 8 9 10 0.2 0.2 0.2 0.2 0.2 0.2 0.2 0.2 0.2 0.2 k 0.05 0.05 0.05 0.05 0.05 0.05 0.05 0.05 0.05 0.05 y 20 19.54288 19.10445 18.68389 18.2804 17.89323 17.52168 17.16506 16.82272 16.49405 c 2.714418 2.693578 2.673283 2.65352 2.63428 2.61555 2.597319 2.579577 2.562313 2.545516 i 2.171534 2.154862 2.138626 2.122816 2.107424 2.09244 2.077855 2.063661 2.04985 2.036413 0.542884 0.538716 0.534657 0.530704 0.526856 0.52311 0.519464 0.515915 0.512463 0.509103 depreciation 1 0.97714418 0.95522275 0.93419444 0.91401992 0.89466172 0.87608413 0.85825311 0.84113622 0.82470254 change in k -0.457116477 -0.438428587 -0.420566212 -0.403490364 -0.387163978 -0.371551811 -0.356620356 -0.342337753 -0.328673705 -0.315599403 From c), we know that the steady state value of k is 8, so we need to find the year in which k falls below 9. Extending the table (for quite a while) gives us the following values: Year δ s 65 66 67 68 69 70 71 72 73 74 0.2 0.2 0.2 0.2 0.2 0.2 0.2 0.2 0.2 0.2 k 0.05 0.05 0.05 0.05 0.05 0.05 0.05 0.05 0.05 0.05 y 9.175941 9.135854 9.097161 9.059812 9.023757 8.988952 8.955351 8.922911 8.891591 8.861351 c 2.093551 2.090498 2.087542 2.084682 2.081912 2.079232 2.076638 2.074128 2.071698 2.069347 i 1.674841 1.672398 1.670034 1.667745 1.66553 1.663386 1.661311 1.659302 1.657359 1.655478 0.41871 0.4181 0.417508 0.416936 0.416382 0.415846 0.415328 0.414826 0.41434 0.413869 depreciation 0.45879706 0.45679272 0.45485806 0.45299058 0.45118787 0.4494476 0.44776755 0.44614555 0.44457955 0.44306756 change in k -0.040086868 -0.038693153 -0.037349591 -0.036054274 -0.034805373 -0.033601134 -0.032439876 -0.031319983 -0.030239908 -0.029198163 From this second table, we see that it will take until year 70 for k to fall below 9. e) What is the Golden Rule level of k for this economy? Report your answer to two decimal places. The Golden Rule level of k is that which produces the highest level of consumption per worker. We find this level by setting MPK = δ, so we have (k 1 / 3 ) MPK (1 / 3)k 2 / 3 0.05 . k Solving for k yields k 2 / 3 .15 k gold (.15) 3 / 2 17.21 . f) Assume that a benevolent social planner wishes to get this economy to the Golden Rule level of k. What savings rate must he impose on individuals to make kgold the steady state level of k? (Hint: this problem will be easier if you use the entire value of kgold from e), not the rounded value you reported.) We know from part c) that steady state is defined by s k 2 / 3 , so we plug in kgold for k 1 20 1 and 0.05 for δ to get s k 2 / 3 0.05 * (20 / 3) . 20 3 3 Thus, our planner must set s = 1/3 to make kgold the steady state level of k. g) Assume that the economy begins at the steady state level of k you found in part c). Do you think the current citizens of this country support the planner’s decision to reach the Golden Rule level of k? Why or why not? In part c), we had s = 1/5. If the economy is in steady state, then getting to kgold will require citizens to begin saving a larger portion of their income, which means that consumption per worker must fall in the short run. Since these current citizens might not live long enough to enjoy the higher consumption per worker will be come in the future, they would likely be against the plan to move to kgold. 2) In the country of Grand Fenwick, the steady state growth rate of real GDP is 4% per year. The population growth rate is 3%, while the rate of technological progress is 5%. The capital stock is 5 times as large as Grand Fenwick’s GDP, and 2% of the capital stock wears out each year. Capital income accounts for half of GDP. a) Is Grand Fenwick at kgold? We know that in the Solow Growth model with technological and population growth, kgold is defined by MPK – δ = n + g. From the problem, we know that δ =.02, n = .03, and g = .05. Thus, we need to solve for MPK. The problem also tells us that total capital income is half of GDP, so rK = MPK*k = .5y. Since there is 5 times as much capital as GDP, k = 5y. Combining these equations yields 1 MPK * k 0.5 y 0.5(k / 5) k , so MPK = 0.1. 10 So MPK – δ = 0.1 – 0.02 = 0.08, and n + g = 0.03 + 0.05 = 0.08. This economy is at kgold. b) If researchers in Grand Fenwick discover a way to double the rate of labor-augmenting technological progress, what will happen to kgold? What can we say about the growth rates of capital per effective worker and output per effective worker in the years following the breakthrough? If g = 0.1, then MPK – δ < n + g. Thus, this economy now has too much capital per worker, so kgold will fall. As the economy transitions to this new steady state, the growth rates of capital per effective worker and output per effective worker must be negative, as both are falling. c) Comparing the steady states before and after the breakthrough, what happens to the growth rates of capital, output, and consumption per worker? In steady state, the growth rates of capital, output and consumption per worker are equal to the rate of technological progress. Thus, as g has doubled from 5% to 10%, so have the growth rates of capital, output, and consumption. 3) The nation of Quodium has the production function Y 20K 1 / 4 ( EL) 3 / 4 and a depreciation rate of 7%. The population of Quodium increases 4% each year, and the rate of technological progress is 5% per year. Assume that all residents of Quodium save 6.4% of their income each year. a) Rewrite the production function in terms of output per effective worker (y) and capital per effective worker (k). Find the steady state levels of capital per effective worker, output per effective worker, consumption per effective worker, and investment per effective worker. Our production function becomes Y 20 K 1 / 4 ( EL) 3 / 4 20 K 1 / 4 y 20k 1 / 4 . EL EL ( EL)1 / 4 In steady state, there must be no change in the capital stock per effective worker, so sf(k) = (δ + n + g)k. Plugging in our known values gives .064(20k 1 / 4 ) (.07 .04 .05)k .16k 8 k 3 / 4 , so k = 16 in steady state. Plugging this back into our production function gives us y (20k 1 / 4 ) 20(16)1 / 4 20 * 2 40 in steady state. Since i = sy, i = (.064)(40) = 2.56, and c = y – i =40 – 2.56 = 37.44 b) What is the steady state growth rate of GDP in Quodium? What is the steady state growth rate of GDP per worker? GDP grows when K or EL increases, and both are growing at the same rate. Since E is increasing at rate g = .05 and L is increasing at rate n = .04, GDP is growing at rate n + g = .04 + .05 = .09. 1/ 4 Y 20 K 1 / 4 ( EL) 3 / 4 20 K 1 / 4 E 3 / 4 K GDP per worker is given by 20 E 3 / 4 . Thus, 1/ 4 L L ( L) L GDP per worker grows when K/L or E increases, and both are growing at rate g = .05. So GDP per worker is growing at rate g = .05.


