Table No. 1
advertisement
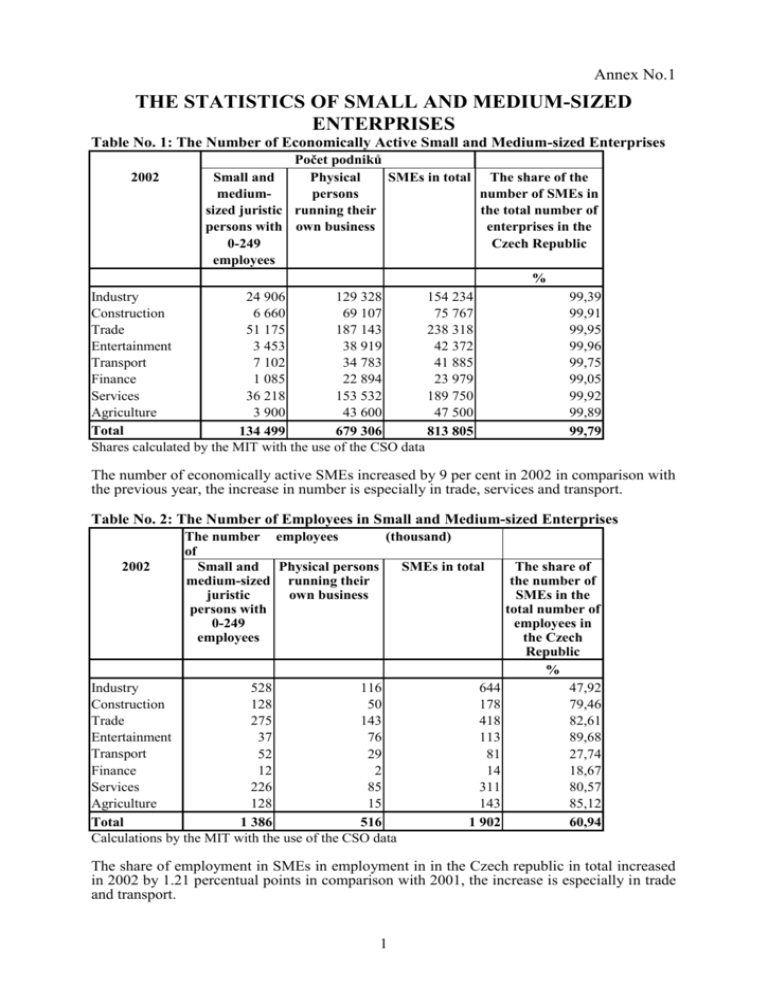
Annex No.1 THE STATISTICS OF SMALL AND MEDIUM-SIZED ENTERPRISES Table No. 1: The Number of Economically Active Small and Medium-sized Enterprises Počet podniků 2002 Small and Physical SMEs in total The share of the mediumpersons number of SMEs in sized juristic running their the total number of persons with own business enterprises in the 0-249 Czech Republic employees % Industry 24 906 129 328 154 234 99,39 Construction 6 660 69 107 75 767 99,91 Trade 51 175 187 143 238 318 99,95 Entertainment 3 453 38 919 42 372 99,96 Transport 7 102 34 783 41 885 99,75 Finance 1 085 22 894 23 979 99,05 Services 36 218 153 532 189 750 99,92 Agriculture 3 900 43 600 47 500 99,89 Total 134 499 679 306 813 805 99,79 Shares calculated by the MIT with the use of the CSO data The number of economically active SMEs increased by 9 per cent in 2002 in comparison with the previous year, the increase in number is especially in trade, services and transport. Table No. 2: The Number of Employees in Small and Medium-sized Enterprises 2002 The number employees (thousand) of Small and Physical persons SMEs in total medium-sized running their juristic own business persons with 0-249 employees Industry 528 116 Construction 128 50 Trade 275 143 Entertainment 37 76 Transport 52 29 Finance 12 2 Services 226 85 Agriculture 128 15 Total 1 386 516 Calculations by the MIT with the use of the CSO data 644 178 418 113 81 14 311 143 1 902 The share of the number of SMEs in the total number of employees in the Czech Republic % 47,92 79,46 82,61 89,68 27,74 18,67 80,57 85,12 60,94 The share of employment in SMEs in employment in in the Czech republic in total increased in 2002 by 1.21 percentual points in comparison with 2001, the increase is especially in trade and transport. 1 Table No. 3: Performance of Small and Medium-sized Enterprises Performance 2002 Industry Construction Trade Entertainment Transport Finance Services Agriculture Total (CZK million) Small and Physical persons medium-sized running their juristic own business persons with 0-249 employees 705 029 184 487 351 813 23 919 112 772 26 443 332 943 96 500 1 833 906 SMEs in total 129 690 55 272 95 121 48 007 66 709 3 800 98 750 26 500 523 849 834 719 239 759 446 934 71 926 179 481 30 243 431 693 123 000 2 357 755 The share of performance in SMEs in the performance in the Czech Republic in total % 34,79 66,79 87,06 86,89 45,21 22,41 86,41 84,25 52,02 Calculations by MIT with the use of the CSO data The share of performance in SMEs in performance in the Czech Republic in total increased by 0.6 percentual points in comparison with 2001. Table No. 4: The value Added Created in the Small and Medium-sized Enterprises 2002 Industry Contruction Trade Entertainment Transport Finance Services Agriculture Total The value added Small and Physical persons medium-sized running their juristic own business persons with 0-249 employees 200 303 44 093 152 800 8 697 27 352 8 424 116 379 26 800 584 848 33 320 12 956 35 297 7 781 23 381 1 800 53 115 8 700 176 350 (CZK million) SMEs in total The share of the value added in SMEs in the value added in the Czech Republic in total % 233 623 37,00 57 049 72,87 188 097 85,18 16 478 81,40 50 733 31,24 10 224 12,49 169 494 82,00 35 500 82,56 761 198 52,69 Calculations by the MIT with the use of the CSO data. The share of the value added in SME in the value added in the Czech Republic in total increased in 2002 by 1.4 percentual points in comparison with 2001. 2 Table No. 5:The Labour Cost without Other Personnel Cost of Small and Medium-sized Enterprises 2002 Labour cost Without OPC (CZK million) Small and Physical persons SMEs in total medium-sized running their juristic own business persons with 0-249 employees The share of labour cost in SMEs in the labour cost in the CR in total % Industry Construction Trade Entertainment Transport Finance Services Agriculture Total 86 643 21 655 58 317 4 484 9 195 4 918 48 989 17 650 251 851 12 671 7 095 13 368 4 768 3 661 247 9 306 1 532 52 648 99 314 28 750 71 685 9 252 12 856 5 165 58 295 19 182 304 499 41,82 73,01 83,00 81,31 22,54 22,85 81,61 83,76 55,50 Calculations by the MIT with the use of the CSO data. The share of labour cost without OPC in SMEs in the CR in total increased in 2002 most in trade (1,32 percentual points) and transport (1,49 percentual points). Table No. 6: Investment (including Land) of Small and Medium-sized Enterprises 2002 Investment (including land (CZK million) pozemků) Small and Physical persons SMEs in total medium-sized running their juristic own business persons with 0-249 employees The share of investment in SMEs in investment in the CR in total % Industry Construction Trade Entertainment Transport Finance Services Agriculture Total 47 404 6 226 31 732 2 847 9 885 4 447 32 763 13 000 148 304 4 544 1 523 5 288 779 3 968 240 3 043 2 600 21 985 51 948 7 749 37 020 3 626 13 853 4 687 35 806 15 600 170 289 30,26 70,64 78,75 79,87 17,86 37,75 88,75 86,67 44,52 Calculations by the MIT with the use of the CSO data. Investment increased in services and finance in 2002 in comparison with 2001.The share of investment in SMEs in investment in the CR in total increased by 6.7 percentual points. 3 Table No. 7: The Comparison of Performance and Value Added per One Employee in SMEs with Performance and Value Added per One Employee in Large Enterprises in 2002. 2002 Industry Construction Trade Entertainment Transport Finance Services Agriculture Total Performance per Performance per one employee in one employee in SME large enterprises (CZK) (CZK) 1 296 148 2 235 556 1 346 961 2 592 022 1 069 220 755 205 636 513 834 923 2 215 815 1 030 716 2 160 214 1 717 000 1 388 080 905 387 860 140 920 000 1 239 619 1 783 885 Value added per one employee in SMEs (CZK) 362 769 320 500 449 993 145 823 626 333 730 286 544 997 248 252 400 209 Value added per one employee in large enterprises (CZK) 568 267 461 826 360 398 289 692 529 204 1 174 197 495 920 300 000 559 880 Calculations the MIT with the use of the CSO data The performance per one employee in SMEs is higher in services, finance, transport and trade than the performance per one employee in large enterprises. The value added per one employee in SMEs is higher in services, transport and trade than value added per one employee in large enterprises. The opposite situation is, for instance, in industry and construction. Note: Tables č. 1 - 7 contain preliminary CSO data taken from preliminary estimations based on quarterly documentation for 2002. The following SCEA categories are included in single sectors in the tables. Sector Industry Construction Trade Entertainment Transport Finance Services Agriculture SCEA C D E F G H I J K SCEA category L M N O Mining Manufacturing Production and distribution of electricity, gas and water Construction Trade, repair of vehicles and consumer goods Entertainment and accommodation Transport, storage, post and telecommunications Finance and insurance Activities in the area of real estates, lease of real estates, services for enterprises and research and development Public administration, defense, social affairs Education Health care Other public, social and personal services A B Agriculture, gamekeeping and connected activities Fishing, connected activities in the framework of fishing 4 Table No. 8: External Trade according to the size of enterprises in the year 2002 The number of employees of an enterprise 2002 Thee amount of exports CZK million Physical persons Juristic persons 0 – 49 The share in exports in total % 40 396 Difference of shares 2002 - 2001 Percentual points 3,2 -1,4 160 637 12,9 Large enterprises 250 and more 799 809 -0,7 24,5 -0,1 19,9 -0,5 23,6 0,8 36,0 -2,8 52,1 -0,1 47,9 0,1 100,0 0,0 690 527 634 752 employees Total 4,1 53 783 312 485 employees. 450 231 Difference of shares 2002 - 2001 Percentual points -0,9 249 198 SMEs 0-249 employees. The share in imports in total % 324 259 employees Juristic persons 50 – 249 The amount of imports CZK million 1 250 040 64,0 2,8 100,0 0,0 1 325 279 Data by CSO The share of small and medium-sized enterprises decreased in 2002 in comparison with 2001 in exports by 2,8 percentual points and in imports by 0,1 percentual points. Higher share of small and medium-sized enterprises in imports than in exports is connected with orientation of trade organisations of this sector. Table No. 9: The Share of SMEs in Chosen Macroeconomic Indicators in % Indicator Year 1997 1998 1999 2000 2001 2002 Number of businesses 99,77 99,78 99,80 99,81 99,81 99,79 Number of employees 59,82 56,35 59,12 59,47 59,73 60,94 Performance 52,91 51,73 53,34 52,85 51,44 52,02 Value added 57,36 51,35 53,03 52,60 51,33 52,69 Labour cost /without OPC/ 1) 1) 54,69 54,67 55,72 55,50 Investment 1) 1) 41,66 40,56 37,81 44,52 Exports 36,40 36,25 36,54 36,15 35,74 36,00 Imports 48,00 48,84 50,74 49,43 47,12 52,10 34,78 34,82 33,57 37,16 GDP 1) 1) The GDP indicator is taken from the data of the CSO, the other shares are calculations of the MIT with the use of the CSO data 1) the indicator for SMEs was not established by the CSO 5 The Graphic Demonstration of the Development of the Economic Indicators of SMEs The Development of Number of SMEs in the CR in 1997 - 2002 Number of juristic persons Number of physical persons Number of enterprises 900 000 813805 800 000 700 000 736034 657 130 679306 630684 568 855 746127 691736 600 000 500 000 760892 658416 634829 590942 400 000 300 000 200 000 88 275 100794 105350 102476 1997 1998 1999 2000 111298 134499 100 000 0 2001 2002 The Development of Number of Employees of SMEs in the CR in 1997-2002 Number of employees (thousand) 1 950 1 902 1 900 1 890 1 850 1 848 1 834 1 800 1 771 1 750 1 721 1 700 1 650 1 600 1997 1998 1999 2000 2001 6 2002 The Development of Performance and Value Added of SMEs in the CR in 1997-2002 Performance (CZK million) Value Added (CZK million) 2 500 000 2 357 755 2 287 962 2 175 162 2 000 000 1 989 996 1 857 105 1 500 000 1 733 985 1 000 000 603 091 653 018 720 493 706 345 761 198 500 000 158 113 0 1997 1998 1999 2000 2001 2002 The Development of Personal and Investment Costs of SMEs in the CR in 1997 - 2002 Personal Costs /without OPC/ (CZK million) Investment Costs in total (CZK million) 350 000 300 000 304 499 250 000 283 207 256 261 265 393 200 000 150 000 170 063 170 001 169 280 170 289 100 000 50 000 0 1999 2000 2001 7 2002 The Development of External Trade of SMEs in the CR in 1997 - 2002 Exports (%) Imports (%) 800000 700000 690527 653860 600000 616472 500000 400000 506032 454200 453403 417323 450231 416326 300000 339524 308352 200000 263006 100000 0 1997 1998 1999 2000 8 2001 2002
