ANALYSIS QUESTIONS! GRADED ASSIGNMENT!! 1) The diagram
advertisement
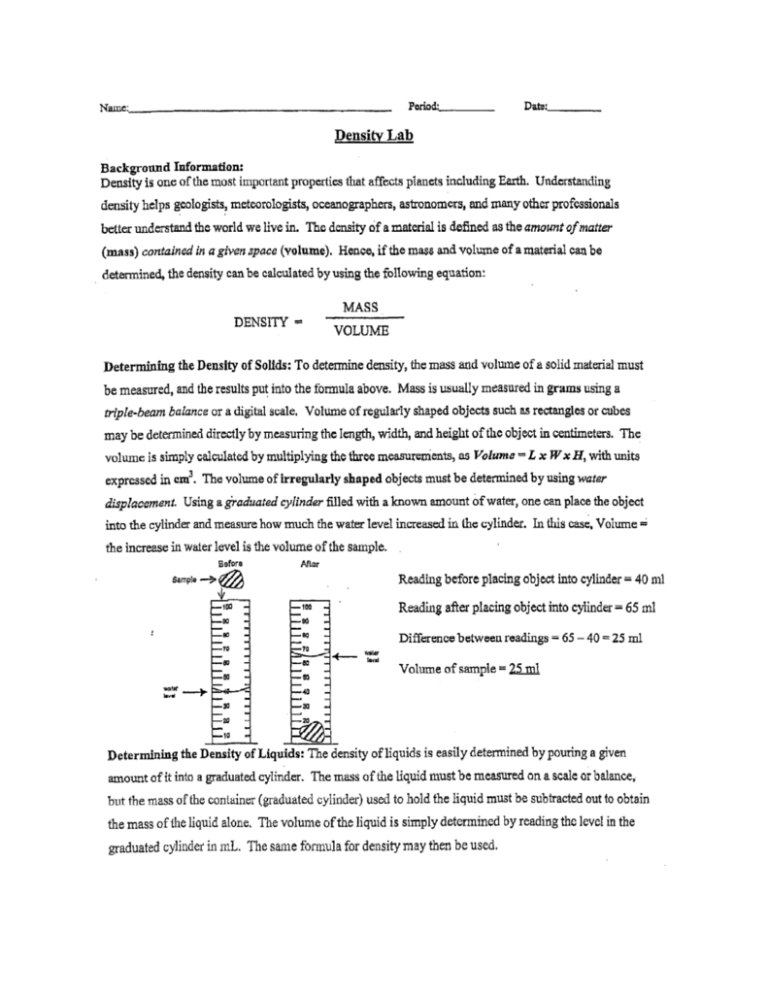
ANALYSIS QUESTIONS! GRADED ASSIGNMENT!! 1) The diagram at the right represents a cylinder which contains four different liquids, W, X, Y, and Z, each with a different density, (D) as indicated. A piece of solid quartz having a density of 2.7 g/cm3 is placed on the surface of liquid W. When the quartz is released, it will pass through 1. 2. 3. 4. W, but not X, Y, or Z W and X, but not Y or Z W, X and Y, but not Z W, X, Y, and Z 2) The diagram below represents a rectangular object with a mass of 450 grams. According to the Earth Science Reference Tables, what is the density of the object? 1. 2. 3. 4. 1 gram per cubic centimeter 2 grams per cubic centimeter 3 grams per cubic centimeter 4 grams per cubic centimeter DIRECTIONS: Base your answers to questions 3 through 5 on your knowledge of earth science, the Earth Science Reference Tables, and the gralph below. The graph shows the mass and volume for five different samples of the mineral pyrite. 3) According to the graph, the density of pyrite is about 1. 2. 3. 4. 0.5 g/cm3 2.5 g/cm3 5.0 g/cm3 7.5 g/cm3 4) If a sample of pyrite has a volume of 50 cm3, its mass would be 1. 2. 3. 4. 15 g 150 g 250 g 350 g 5) If one of the original samples of pyrite were cut in half, the density of each half would be 1. less than the original sample 2. greater than the original sample 3. the same as the original sample DIRECTIONS: Base your answers to questions 6 through 10 on your knowledge of earth science, the Earth Science Reference Tables, and the diagrams below. The diagrams represent three samples of the same substance, each having a different size and shape. [The diagrams are not drawn to scale.] 6) Which order of letters ranks the samples by volume from largest to smallest? 1. 2. 3. 4. A, B, C A, C, B C, B, A C, A, B 7) What is the density of sample A? 1. 2. 3. 4. 0.33 g/cm3 2.0 g/cm3 3.0 g/cm3 4.0 g/cm3 8) If sample B were split in half, what would be the density of each piece? 1. 2. 3. 4. 1.0 g/cm3 1.5 g/cm3 3.0 g/cm3 6.0 g/cm3 9) Which graph best represents the relationship between the mass and volume of the substance? (1) (2) (3) 10) If sample C were compressed, which would probably occur? 1. 2. 3. 4. The volume would decrease and the density would decrease. The volume would decrease and the density would increase. The volume would increase and the density would increase. The volume would increase and the density would decrease. (4)

