Population by Suburb and Township in the Geelong Region, 2001
advertisement
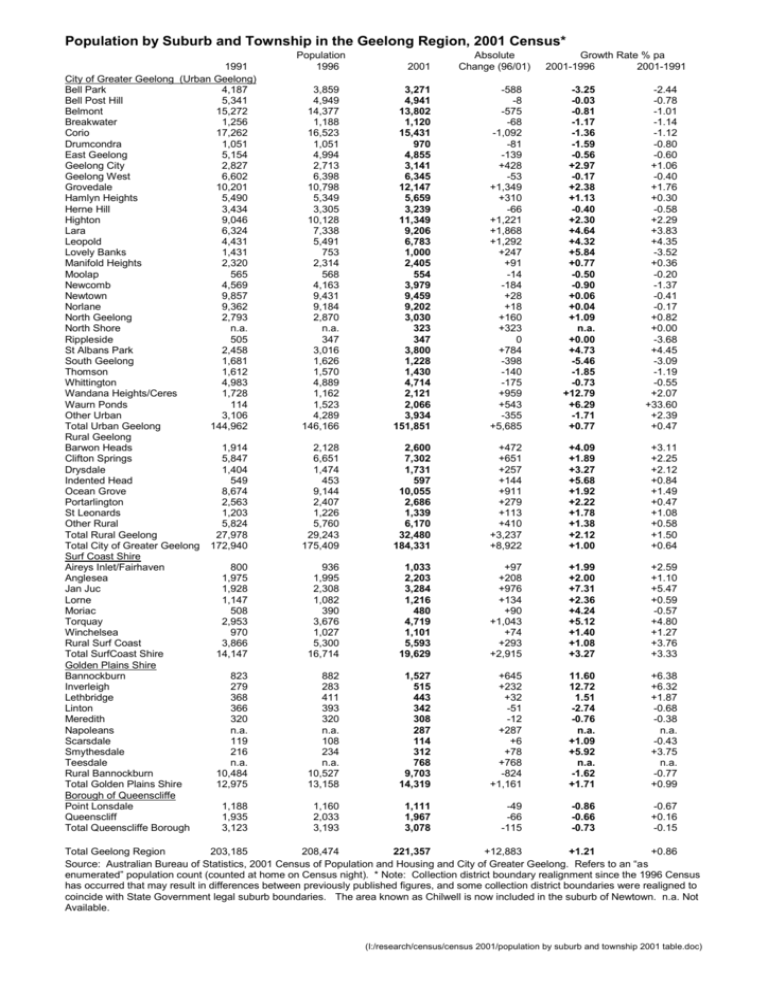
Population by Suburb and Township in the Geelong Region, 2001 Census* 1991 City of Greater Geelong (Urban Geelong) Bell Park 4,187 Bell Post Hill 5,341 Belmont 15,272 Breakwater 1,256 Corio 17,262 Drumcondra 1,051 East Geelong 5,154 Geelong City 2,827 Geelong West 6,602 Grovedale 10,201 Hamlyn Heights 5,490 Herne Hill 3,434 Highton 9,046 Lara 6,324 Leopold 4,431 Lovely Banks 1,431 Manifold Heights 2,320 Moolap 565 Newcomb 4,569 Newtown 9,857 Norlane 9,362 North Geelong 2,793 North Shore n.a. Rippleside 505 St Albans Park 2,458 South Geelong 1,681 Thomson 1,612 Whittington 4,983 Wandana Heights/Ceres 1,728 Waurn Ponds 114 Other Urban 3,106 Total Urban Geelong 144,962 Rural Geelong Barwon Heads 1,914 Clifton Springs 5,847 Drysdale 1,404 Indented Head 549 Ocean Grove 8,674 Portarlington 2,563 St Leonards 1,203 Other Rural 5,824 Total Rural Geelong 27,978 Total City of Greater Geelong 172,940 Surf Coast Shire Aireys Inlet/Fairhaven 800 Anglesea 1,975 Jan Juc 1,928 Lorne 1,147 Moriac 508 Torquay 2,953 Winchelsea 970 Rural Surf Coast 3,866 Total SurfCoast Shire 14,147 Golden Plains Shire Bannockburn 823 Inverleigh 279 Lethbridge 368 Linton 366 Meredith 320 Napoleans n.a. Scarsdale 119 Smythesdale 216 Teesdale n.a. Rural Bannockburn 10,484 Total Golden Plains Shire 12,975 Borough of Queenscliffe Point Lonsdale 1,188 Queenscliff 1,935 Total Queenscliffe Borough 3,123 Population 1996 2001 Absolute Change (96/01) Growth Rate % pa 2001-1996 2001-1991 3,859 4,949 14,377 1,188 16,523 1,051 4,994 2,713 6,398 10,798 5,349 3,305 10,128 7,338 5,491 753 2,314 568 4,163 9,431 9,184 2,870 n.a. 347 3,016 1,626 1,570 4,889 1,162 1,523 4,289 146,166 3,271 4,941 13,802 1,120 15,431 970 4,855 3,141 6,345 12,147 5,659 3,239 11,349 9,206 6,783 1,000 2,405 554 3,979 9,459 9,202 3,030 323 347 3,800 1,228 1,430 4,714 2,121 2,066 3,934 151,851 -588 -8 -575 -68 -1,092 -81 -139 +428 -53 +1,349 +310 -66 +1,221 +1,868 +1,292 +247 +91 -14 -184 +28 +18 +160 +323 0 +784 -398 -140 -175 +959 +543 -355 +5,685 -3.25 -0.03 -0.81 -1.17 -1.36 -1.59 -0.56 +2.97 -0.17 +2.38 +1.13 -0.40 +2.30 +4.64 +4.32 +5.84 +0.77 -0.50 -0.90 +0.06 +0.04 +1.09 n.a. +0.00 +4.73 -5.46 -1.85 -0.73 +12.79 +6.29 -1.71 +0.77 -2.44 -0.78 -1.01 -1.14 -1.12 -0.80 -0.60 +1.06 -0.40 +1.76 +0.30 -0.58 +2.29 +3.83 +4.35 -3.52 +0.36 -0.20 -1.37 -0.41 -0.17 +0.82 +0.00 -3.68 +4.45 -3.09 -1.19 -0.55 +2.07 +33.60 +2.39 +0.47 2,128 6,651 1,474 453 9,144 2,407 1,226 5,760 29,243 175,409 2,600 7,302 1,731 597 10,055 2,686 1,339 6,170 32,480 184,331 +472 +651 +257 +144 +911 +279 +113 +410 +3,237 +8,922 +4.09 +1.89 +3.27 +5.68 +1.92 +2.22 +1.78 +1.38 +2.12 +1.00 +3.11 +2.25 +2.12 +0.84 +1.49 +0.47 +1.08 +0.58 +1.50 +0.64 936 1,995 2,308 1,082 390 3,676 1,027 5,300 16,714 1,033 2,203 3,284 1,216 480 4,719 1,101 5,593 19,629 +97 +208 +976 +134 +90 +1,043 +74 +293 +2,915 +1.99 +2.00 +7.31 +2.36 +4.24 +5.12 +1.40 +1.08 +3.27 +2.59 +1.10 +5.47 +0.59 -0.57 +4.80 +1.27 +3.76 +3.33 882 283 411 393 320 n.a. 108 234 n.a. 10,527 13,158 1,527 515 443 342 308 287 114 312 768 9,703 14,319 +645 +232 +32 -51 -12 +287 +6 +78 +768 -824 +1,161 11.60 12.72 1.51 -2.74 -0.76 n.a. +1.09 +5.92 n.a. -1.62 +1.71 +6.38 +6.32 +1.87 -0.68 -0.38 n.a. -0.43 +3.75 n.a. -0.77 +0.99 1,160 2,033 3,193 1,111 1,967 3,078 -49 -66 -115 -0.86 -0.66 -0.73 -0.67 +0.16 -0.15 Total Geelong Region 203,185 208,474 221,357 +12,883 +1.21 +0.86 Source: Australian Bureau of Statistics, 2001 Census of Population and Housing and City of Greater Geelong. Refers to an “as enumerated” population count (counted at home on Census night). * Note: Collection district boundary realignment since the 1996 Census has occurred that may result in differences between previously published figures, and some collection district boundaries were realigned to coincide with State Government legal suburb boundaries. The area known as Chilwell is now included in the suburb of Newtown. n.a. Not Available. (I:/research/census/census 2001/population by suburb and township 2001 table.doc)

